Check out our current IT Industry Analysis for 2017!
Section 1:
IT Industry and IT Workforce Overview
Key Points
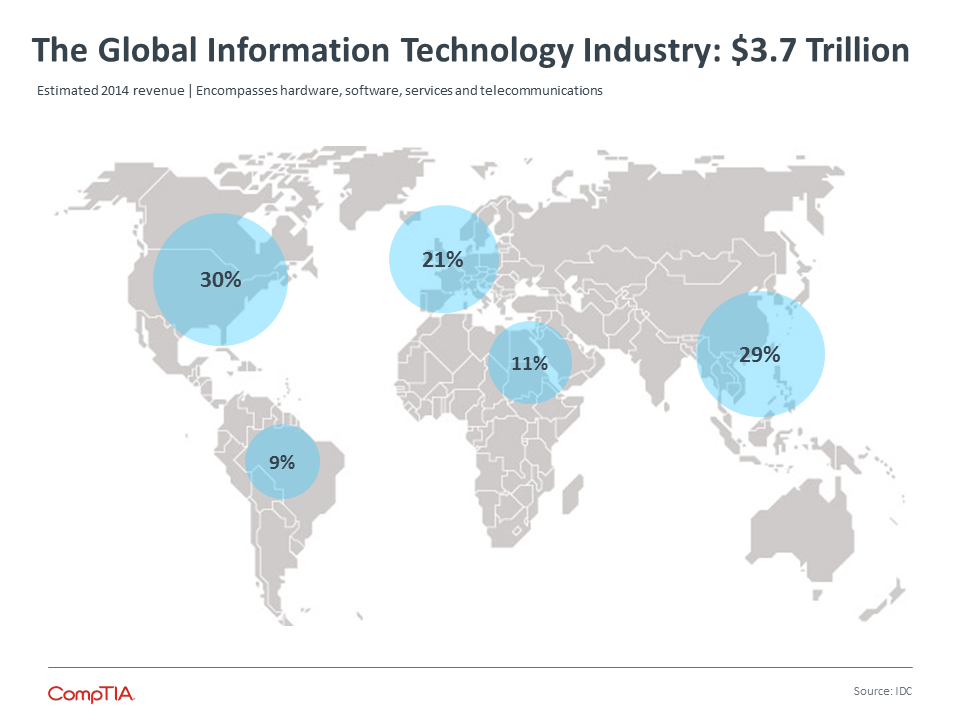
- According to the research consultancy IDC, the global information technology (IT) market totaled more than $3.7 trillion in 2014. The U.S. market accounts for approximately 28% of the total, or slightly more than $1 trillion in hardware, software, IT services and telecommunications.
- The IT channel can be described as the mechanism for facilitating the flow of technology goods and services from producer to customer. The intermediaries that comprise the channel, such as VARs, solution providers, and MSPs, play a valuable role in installing, integrating, and supporting the wide range of technologies used by businesses today. Estimates suggest upwards of 70% of IT products and services sold to U.S. businesses flow through or are influenced by indirect channels in some way.
- There are two distinct elements of the IT workforce: 1) Employment in the IT sector, and 2) IT occupations spanning all industry sectors. In the aggregate, the IT sector employs approximately 5.73 million workers in technical (e.g. software developers, network administrators, etc.) and non-technical (e.g. HR, finance, marketing) positions. The second element of the IT workforce, IT occupations, consists of the more than 4.88 million workers found in IT departments across businesses in every industry vertical in the economy. In addition to core IT occupations, those primarily found in IT departments, there are millions of additional technology-intense knowledge workers on the periphery that comprise the information technology universe.
- Because the need for technology is so pervasive among businesses of all types, it follows that IT jobs are spread across every region of the country. While tech clusters do exist – think Silicon Valley or Silicon Alley, with high concentrations of IT workers, many other regions have notable numbers of IT workers or IT companies as well. The top five states for IT worker employment include California, Texas, New York, Virginia, Florida.
Defining the Information Technology (IT) Industry
The term technology commonly refers to society’s application of scientific knowledge to solve practical problems in industry or commerce. Technological innovation, or the application of technology, takes many forms and often involves the interplay of expertise across multiple disciplines and industry verticals. One framework for categorizing technology entails the use of five distinct groupings.

Each segment of this technology framework has contributed to economic growth and the well-being of society. The magnitude of advances in medicine, transportation, safety, manufacturing, agriculture, media and communication are almost difficult to comprehend.
Since the turn of the millennium though, the one segment that arguably has had the greatest impact on businesses, consumers and other industry sectors is information technology (IT).
Information Technology (IT) can be defined as the utilization of computing via hardware, software, services and infrastructure to create, store, exchange and leverage information in its various forms to accomplish any number of objectives. Additionally, the term encompasses the workers that develop, implement, maintain and utilize information technology directly or indirectly.
Examples of the Key Elements of the IT Definition:
Hardware: computers, servers, storage, tablets, mobile phones, printers, network equipment
Software: productivity and business applications, network and security applications,
mobile apps
Services: deployment, integration, custom development, break/fix, managed services
Infrastructure: Internet backbone, telecommunications networks, cloud data centers
Information: data, documents, voice, video and images
Business Objectives: commerce, production, communication, collaboration, governance
The remainder of this report focuses on the information technology (IT) portion of the technology ecosystem. For additional details of the CompTIA definition of information technology (IT) based on U.S. NAICS codes, please see the Appendix.
Sizing the Information Technology (IT) Market
According to the research consultancy IDC, the global information technology (IT) market reached an estimated $3.7 trillion in 2014. This covers revenue generated from the sale of hardware, software, IT services, and telecommunications.
The vast majority of spending stems from IT purchases made by business or enterprises, with a small portion coming from consumer spending. With the increasing blurring of work and personal life, especially in the SMB space, along with the BYOD phenomenon, it is difficult to classify certain types of technology purchases as being solely business or solely consumer.
The U.S. market represents about 28% of the worldwide total, or slightly over $1 trillion.
Over the years, market proportions have gradually shifted due to the emergence of rapidly growing markets in Asia, Latin America, Africa and Eastern Europe.
For 2015, CompTIA’s consensus forecast projects 5.0% growth. In current dollars, this translates to $185 billion in new revenue, propelling the global IT market to nearly $3.9 trillion. See Section II of this report for detailed analysis of the 2015 outlook.
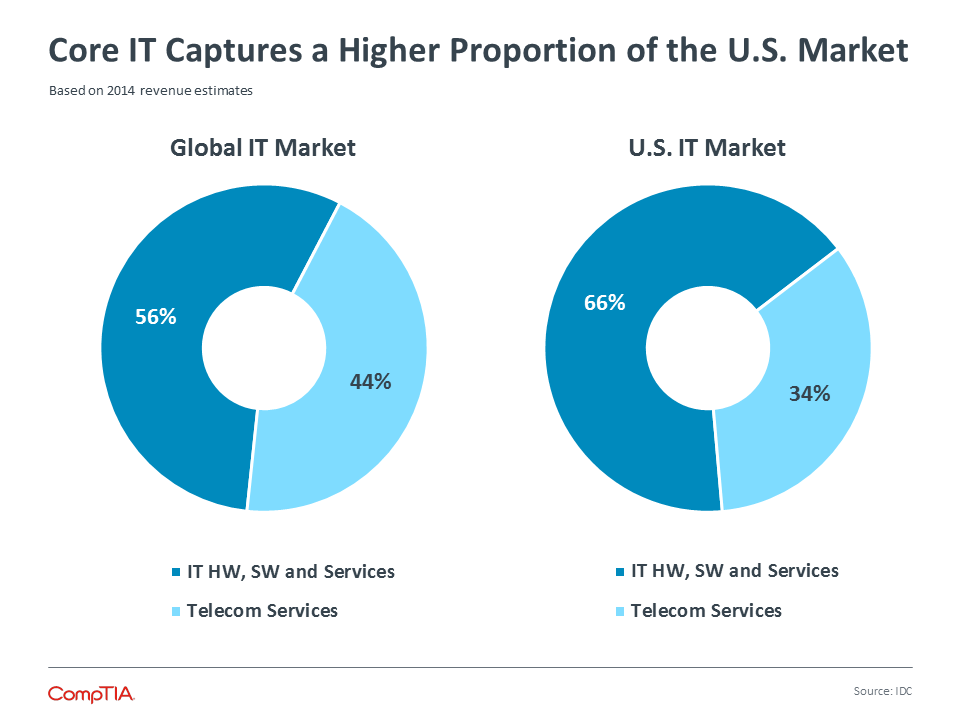
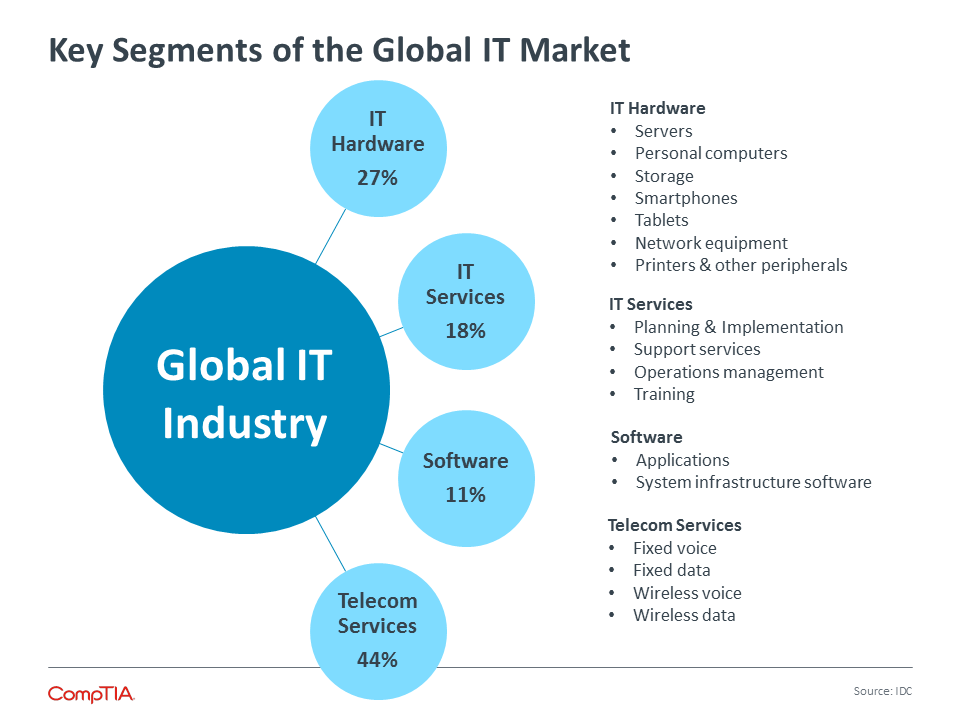
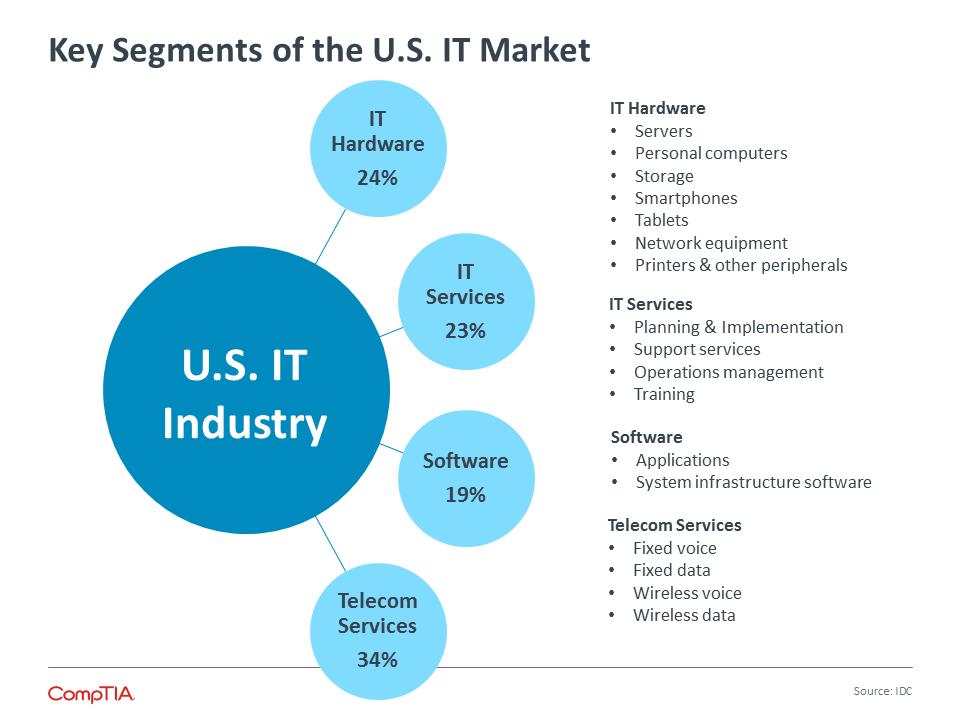
Breaking the IT market down into its core components provides a mechanism to better understand industry dynamics. On a global basis, the hardware, software and services categories – core IT, account for 56% of the industry, with telecom services accounting for the remaining 44%.
The allocation of spending tends to vary from country to country. Some markets may be relatively immature in the traditional categories of computers and software, and yet relatively advanced in the areas of mobility and wireless communication. As result, their spending allocation may skew towards telecom and data services, while they play “catch-up” in the other categories.
Conversely, the U.S. market features a large installed base of hardware, software and services. Not that telecom services are unimportant in the United States, but rather, the spending on the aforementioned categories is much higher relative to the global benchmark. In the U.S. market, IT services and software capture larger shares compared to the global market: 23% vs. 18% and 19% vs. 11%, respectively.
Within each category several dynamics may be at play that affect the ratios. In hardware, for example, as the number of units increases and manufacturers reach economies of scale, prices tend to fall. As prices fall the product may attract more buyers, which helps offset the lower average per-unit price. At some point, however, the total revenue generated for the product plateaus and eventually enters a period of decline. Because the ratios in the chart above are revenue-based, categories prone to pricing pressure can lose share, even when turning over high volumes.
When considering the IT market, it is worth taking note that other sectors are gradually adding a stronger IT component to their space. Think of AV components that are now being connected to an IP network or the service needed for consumer appliances that have sensors and connections. The lines are blurring more and more between core IT and other industries.
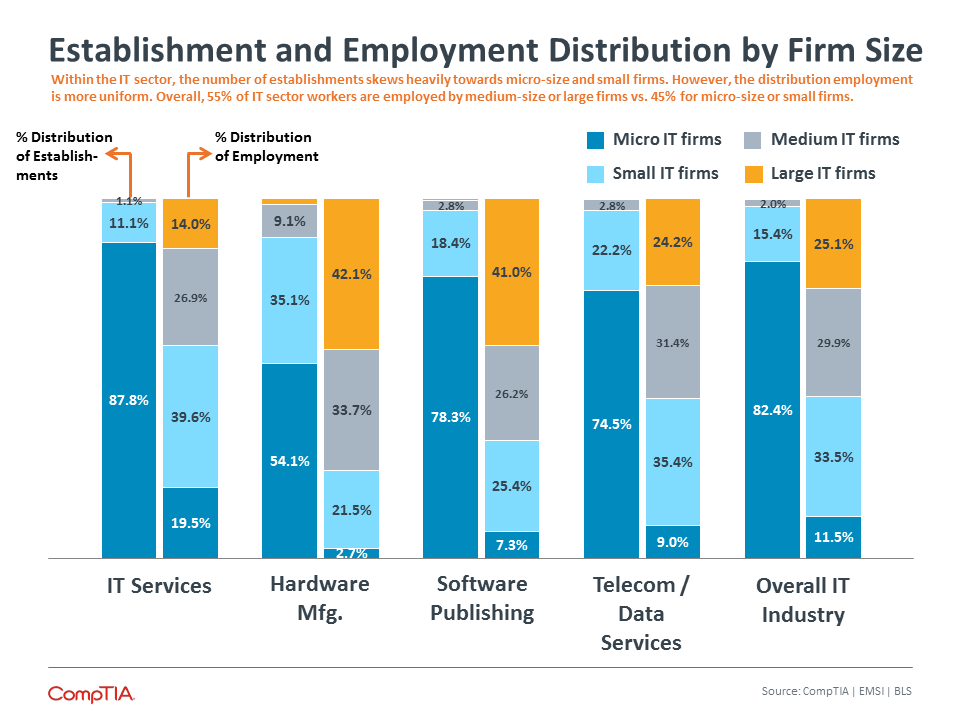
Defining the IT Channel
Every industry sector across the economy has a distribution mechanism to connect customers to products and services. While some producers or manufacturers of goods sell direct to customers, most rely on intermediaries, or indirect channels, that can more efficiently or effectively deliver products and services to customers.
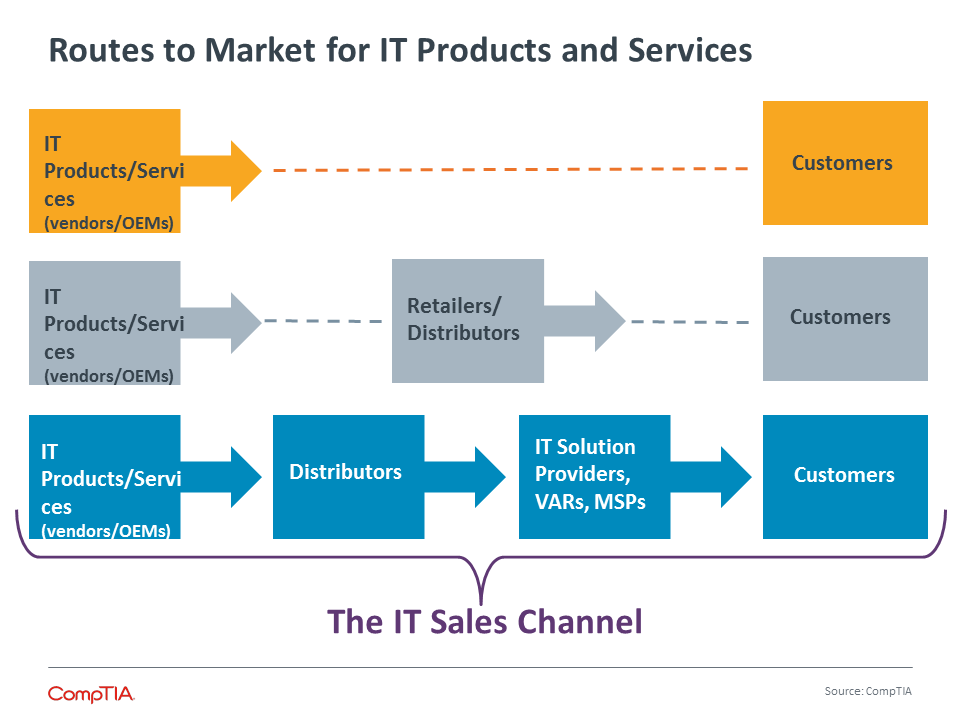
In the information technology sector, this mechanism is referred to as the IT channel. As depicted in the chart to the right, technology vendors or OEMs develop a product, which may then flow through a distributor and/or a value added reseller (VAR) before reaching the customer.
Among those outside the IT industry, it is not uncommon to wonder why vendors do not simply sell directly to customers. In some cases, vendors do sell directly to customers. A small software vendor may sell direct to customers via the software-as-a-service model. Or, a hardware vendor may sell a large order of servers for a datacenter directly to an enterprise level customer. In many cases, though, vendors see value in working through their channel partners. Estimates suggest 65% to 75% of core IT products flow through or are influenced by indirect sales channel. The primary benefits of the channel model include:
Implementation – many IT products require set-up, integration, testing and in some cases, custom development. Even for sophisticated customers, this can be a challenging endeavor. By relying on channel partners, such as solution providers, for implementation, vendors can focus on innovation and design. This is especially critical for small customers, such as a small law firm, that need IT expertise, but do not have the scale to be able to work with a large IT vendor.
Support/Maintenance – customers expect a lot from their IT investments. They demand maximum uptime, ease of use and security safeguards. Even with advances in remote monitoring and support, a technical problem may require a visit to a customer’s office. The large number of solution providers and MSPs spread across the country are well equipped to meet customers’ need for local service.
Specialization – IT has entered the era of specialization. The needs of one customer segment are often quite different from another segment (think healthcare technology vs. manufacturing technology vs. retail technology). Because vendors cannot be experts in every sector, solution providers fulfill this need. Channel partners are often well positioned to develop deep expertise of a sector’s operations, regulations and challenges, resulting in technology solutions optimized to meet customers’ needs.
Sizing the IT Channel
Size estimates of the U.S. IT channel tend to vary. This may be a function of definition, methodology or limitations in the ways technology companies are classified.
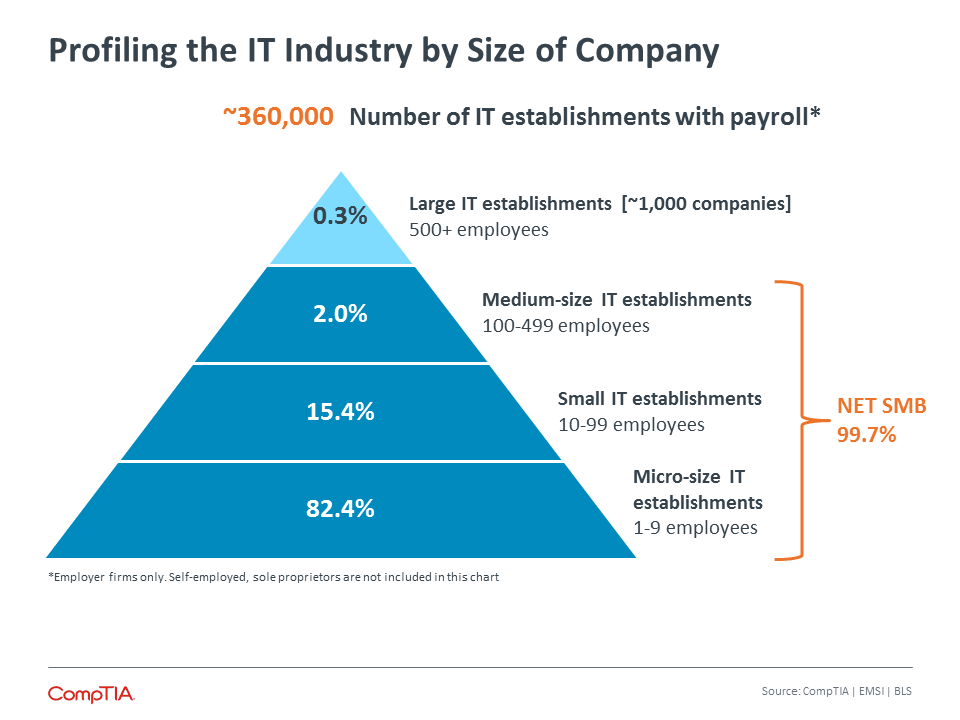
Using the U.S. Commerce Department’s North American Industry Classification System (NAICS), there are three primary categories associated with the IT channel. The sum of these categories, as outlined in the chart below, equates to 125,502 establishments with employees. This can be viewed as one interpretation of the size of the U.S. channel by the count of establishments.
An even broader interpretation may include the large pool of self-employed, sole-proprietors. These could be individuals providing IT consulting services, web design, mobile app development, or technical support services. Some individuals engage in these lines of business on the side, further complicating the sizing process. The self-employed segment adds another 208,463 individuals (or about 334,000 in total), resulting in an even broader interpretation of what could be considered the IT channel.
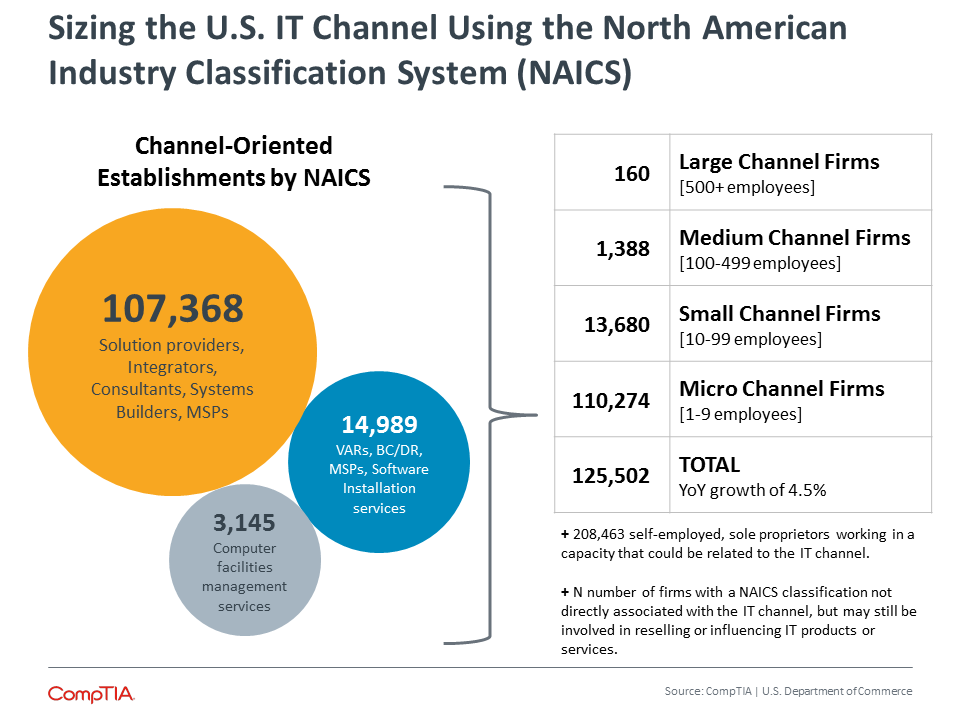
Conversely, among hardware, software or telecom vendors seeking partners to resell their products or partners to engage with customers on their behalf, many require channel partners of a certain level of scale and sophistication. In this scenario, a vendor may focus on the sub-segment of channel firms with 10 or more employees, which equates to 15,288 establishments. Following the 80-20 rule, some vendors may focus their efforts on even a narrower slice of the channel, leaving the large remaining segment for less formal engagement (often referred to as the unmanaged channel).
The other component of channel sizing entails estimates of the revenue flowing through or influenced by the channel. The traditional rule of thumb is about 70% of non-consumer IT hardware and software is sold through indirect channels. This covers the different types of channel partner firms, such as VARs, solution providers, integrators, MSPs and related, as well as distributors, retailers and any other type of intermediary involved in providing the product or service to the customer. Applying the 70% figure to an estimate of U.S. hardware and software sales, yields a ballpark figure of $260 billion flowing through or influenced by the channel.
IT services can also be resold or distributed through intermediaries. For example, a vendor providing their channel partners a turnkey managed print services solution they can offer their customers. Some portion of the $200 billion+ IT services market can be applied to the IT channel sizing calculation.
Defining the IT Workforce
There are two distinct elements of the IT workforce: 1) Employment within information technology companies, and 2) IT occupations.
IT Occupation Employment
- Includes technical occupations, such as software developers, network engineers, computer support specialists, etc. working in a range of industry verticals, such as healthcare, education, manufacturing, professional services and others.
- Beyond core IT occupations, there are a range of technology-intense positions on the periphery, typically referred to as knowledge workers. For the purposes of this report, CompTIA excludes this class of worker from core IT occupations figures (see next page for additional detail).
IT Industry Employment
- Includes technical occupations, such as software developers, network engineers, computer support specialists, etc.
- Includes non-technical professions, such as sales, marketing, HR, finance, operations and general management that support and facilitate the operation of IT companies.
- Typically, technical positions account for 25% to 75% of an IT company’s workforce. There are a number of factors that affect this rate. For example, a start-up may initially be comprised of nearly all software architects, programmers and other technical workers. When the firm scales, it may begin to add sales and marketing staff, thereby reducing the percentage of technical workers.
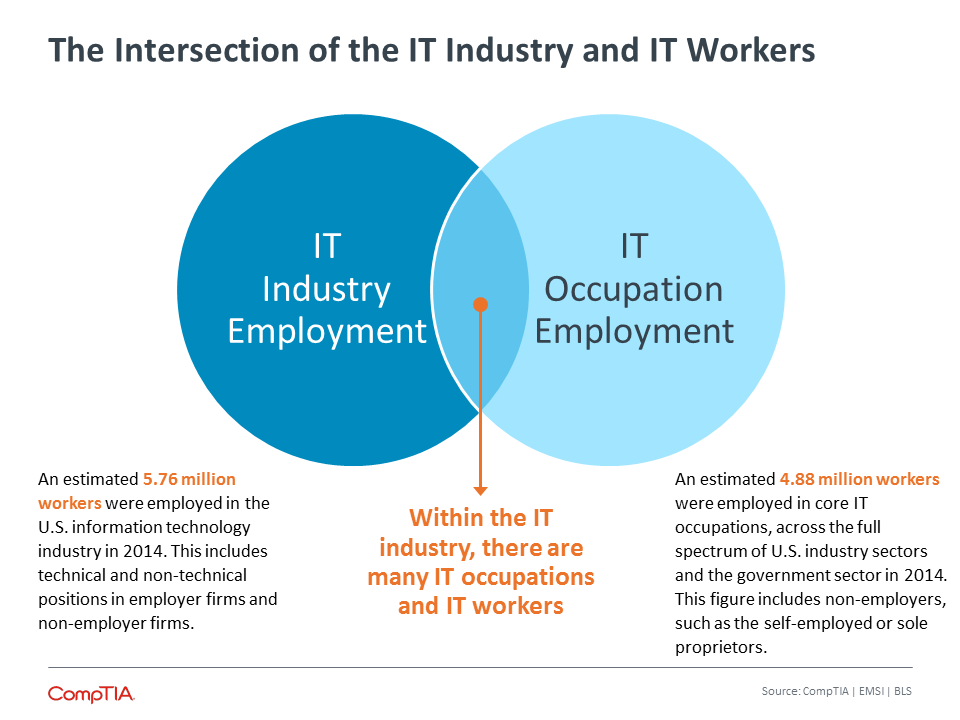
IT Occupation Employment – this segment of the IT workforce employs approximately 4.88 million workers as of year-end 2014. This translates to job growth of 2.4%, or nearly 116,000 additional IT jobs. The 2014 IT job growth rate is up slightly over the 2013 rate of 2.1%. To further put into context, 2.1%, or nearly 100,000 additional IT jobs. In contrast, total job growth across the U.S. economy in 2013 will likely end up in the 1.5% to 1.8% range.
IT occupation employment spans every industry vertical. For example, the IT department within a hospital will employ a range of senior-, mid- and staff-level IT workers to ensure physicians, nurses and administrators have reliable access to computers, networks, applications and so on.
Top IT Growth Occupations in 2014 (Percent Change)
- Web Developers
- Information Security Analysts
- Computer Systems Analysts
- Software Developers, Applications
- Software Developers, Systems Software
- Computer User Support Specialists
- Computer and Information Systems Managers
- Database Administrators
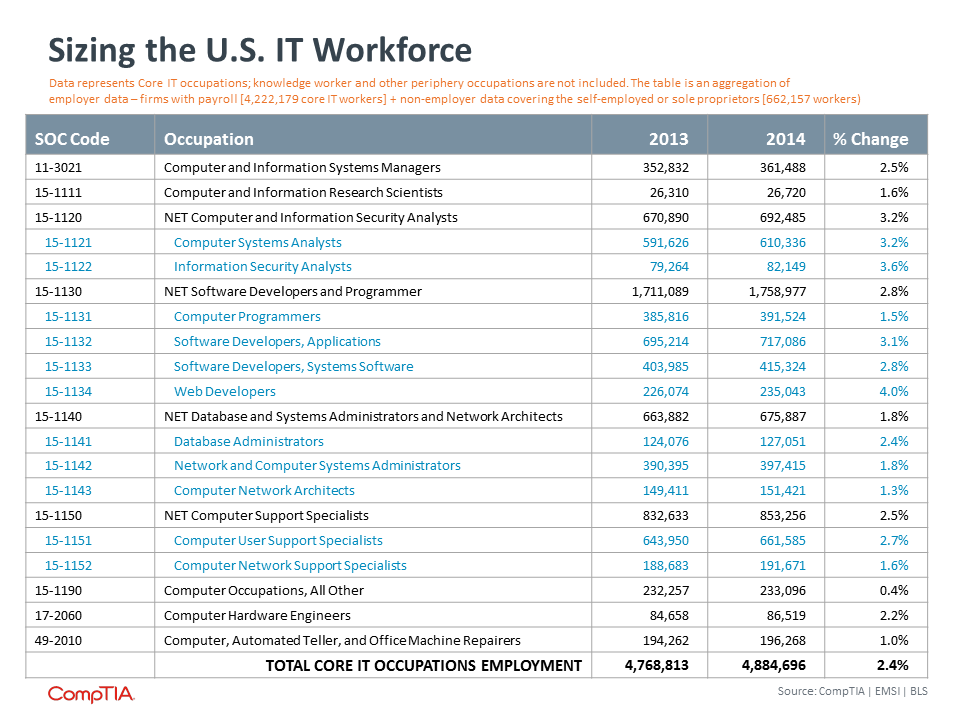
In addition to core IT positions, there are many technology-intense occupations on the periphery. For example, occupations such as IT project management, health information technicians, audio/video technicians, technical sales, technical writers, automated manufacturing computer operators and IT training positions, all require significant expertise and experience with various aspects of technology. While these positions are not typically found in an ‘IT Department’ they are an important component of the IT workforce. Depending on the criteria used, peripheral or knowledge worker-type positions may number between 1 million and several million additional workers.
Because the need for technology is so pervasive among businesses of all types, it follows that IT jobs are spread across every region of the country. While tech clusters do exist – think Silicon Valley or Silicon Alley, with high concentrations of IT workers, many unassuming regions have large numbers of IT workers as well. For example, more than 325,000 IT workers can be found in the Mountain states region.
On a percent change basis, the states with the fastest IT job growth in 2014 include: Nevada, Texas, Montana, Florida, North Carolina, North Dakota, Delaware, Utah and West Virginia. Each of these states experienced job growth of 4.0% or higher. In comparison, overall core IT job growth reached 2.4%.
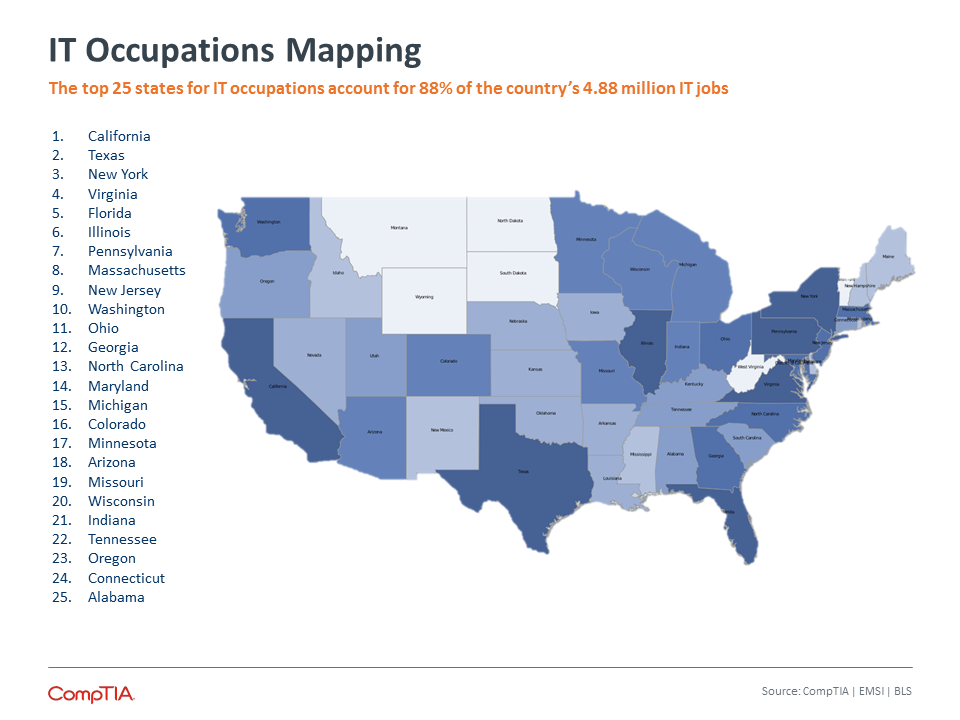
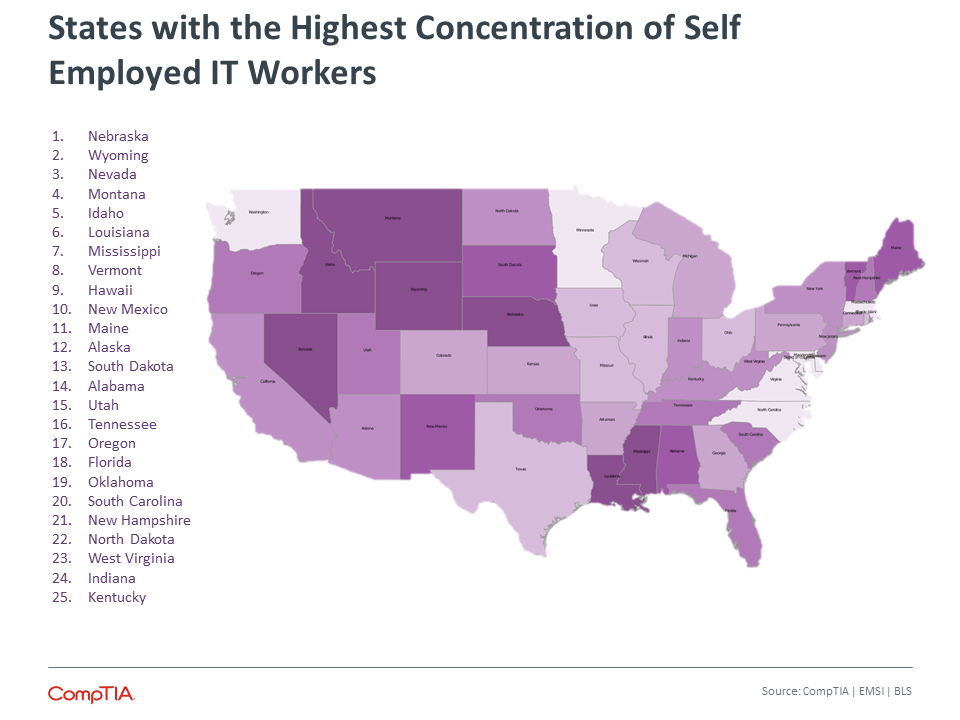
This map represents an aggregation of data for employer firms – those with payroll, and the self-employed. The states with the highest concentration of self-employed IT workers include: Nebraska, Wyoming, Nevada, Montana, Idaho, Louisiana, Mississippi and Vermont. In each of these states, the percentage of self-employed IT worker exceeds 20% of the state’s total IT occupation workforce. See Appendix for further details.
IT Employment Outlook
According to the U.S. Bureau of Labor Statistics (BLS), the national unemployment rate stood at 5.5% as of December 2014, down from 6.6% during the same period in 2013. The U.S. employment situation has slowly and steadily improved over the past 36 months. The official BLS unemployment rate does not include discouraged workers – those that have stopped looking for work, as well as those working part-time but seeking full-time employment. When considering these segments, the more expansive unemployment and underemployment rate portrays a less rosy job landscape.
The unemployment rate for the BLS computer and mathematical occupation category, a reasonable approximation of IT occupations, continues to remain far lower than the national rate. For November 2014, the category recorded an employment rate of 2.0%, less than half the national rate. This recent percentage is down from the already low rates of 3.3% in 2013 and 2012.
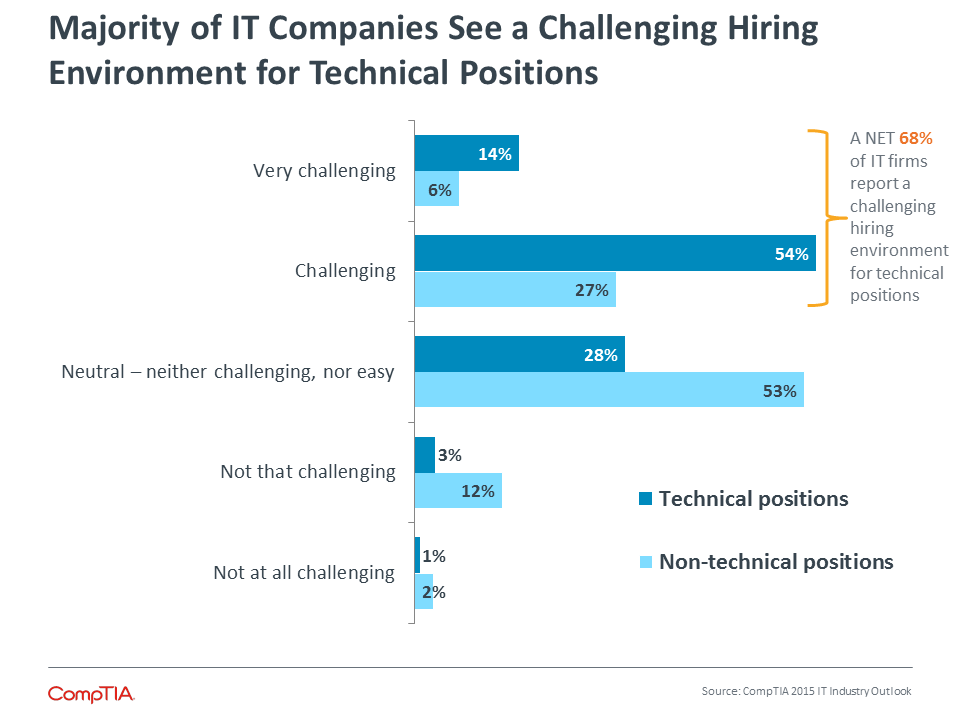
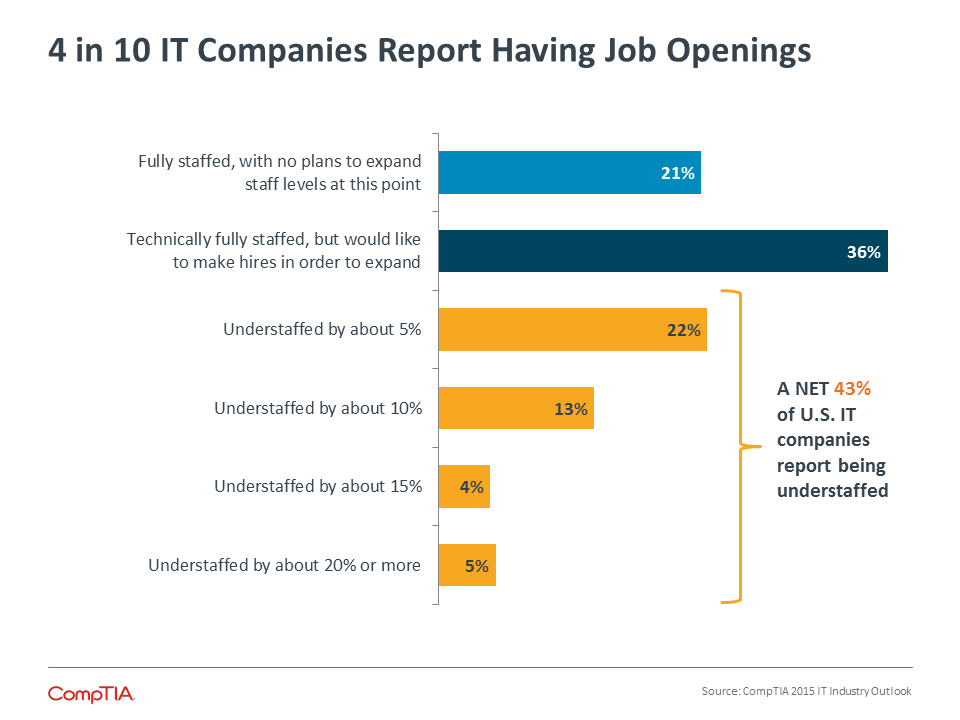
The low unemployment rate for IT workers combined with strong demand for certain skill sets can make for a challenging hiring environment. Sixty-eight percent of IT company executives say they expect to face a challenging or very challenging hiring environment for technical positions in 2015.
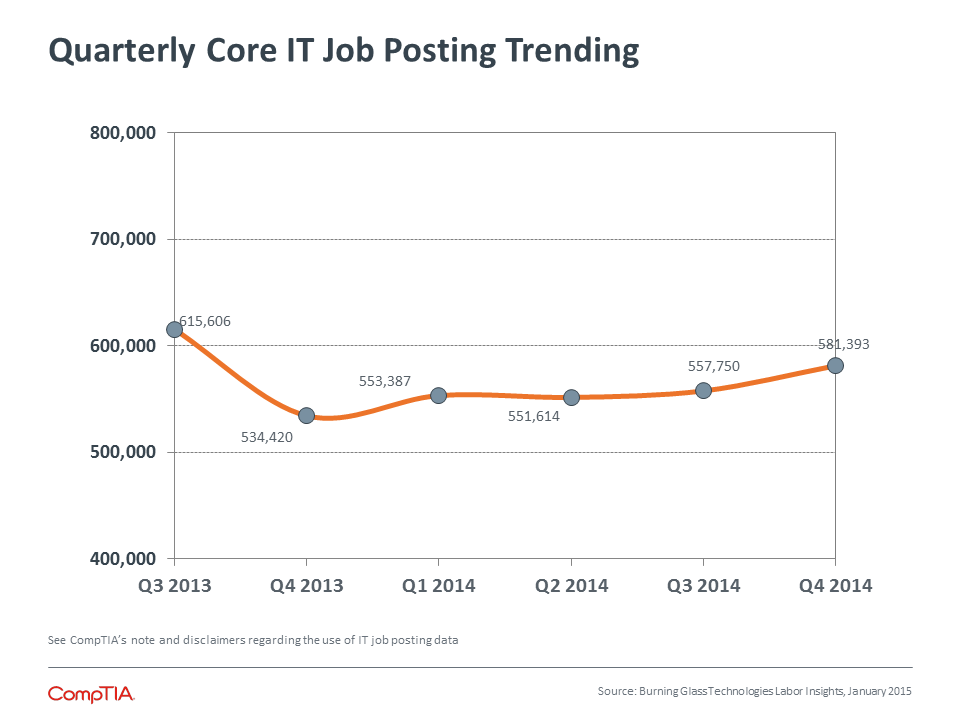
According to Burning Glass Technologies Labor Insights, U.S. businesses posted job notices for approximately 580,000 core IT jobs during Q4 of 2014, a slight increase over Q3.
As indicated previously, the total core IT occupation workforce increased by 116,000 jobs in 2014. This explains a portion of the job posting data. Companies may be expanding or moving into new areas and need to employ more workers.
The other factor at play is workforce churn, also referred to as labor turnover. This may include separations due to workers that retire, leave to pursue over employment opportunities, leave to pursue additional education, leave for family reasons, or are fired or laid-off. This helps explain why the number of job postings exceeds the number of new IT jobs created.
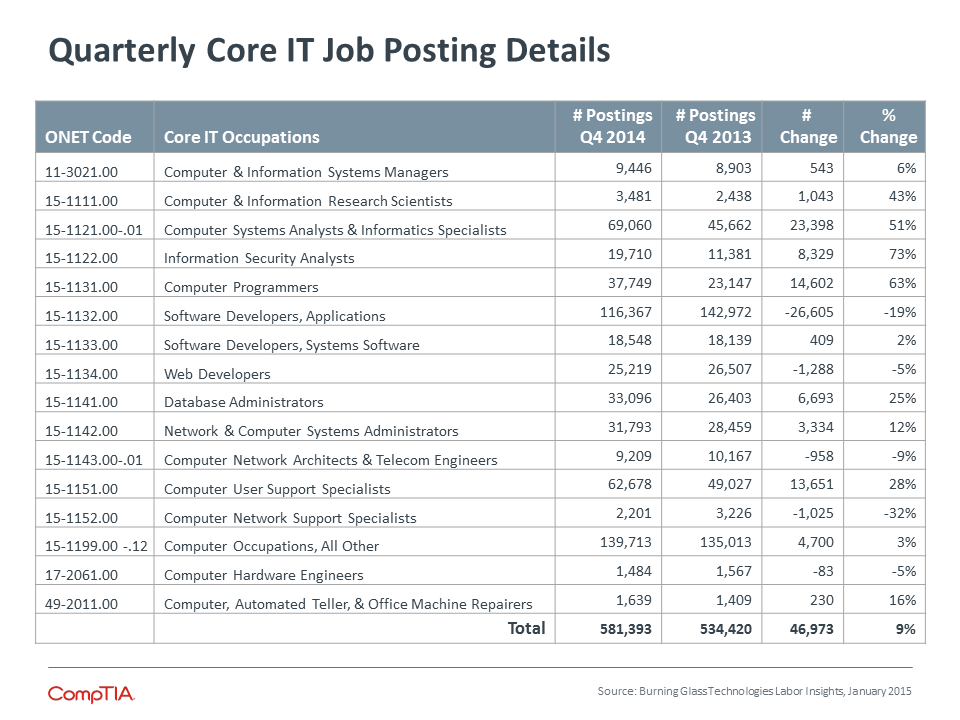

Job posting data is a useful, but an imperfect proxy for job demand. Not every posting translates to a new job; hiring firms may change their plans, post multiple times for the same job, hire internally, try different approaches to find the right candidate and so forth (see Notes area). Also, one ad may be posted for multiple openings. Burning Glass Technologies Labor Insights addresses many of these issues, but not all. Additionally, within a time period, there may be situations where a worker is hired, the person isn't the right fit and is let go, and a firm starts the process over again. In the aggregate there is single position, but using job posting data, it may appear there are two positions (see labor turnover data to gauge the frequency of this practice).
CompTIA recommends using job posting data in conjunction with BLS data to get a more complete picture of labor dynamics for a given occupation category.
Appendix | Frequently Asked Questions
How large is the information technology (IT) sector relative to other industry sectors in the U.S. economy?
The IT sector, including telecommunications, is one of the larger industry sectors in the U.S. economy. To put into perspective,
the gross output of the technology sector exceeds that of the legal services industry, the automotive industry, the airline industry, the motion picture industry, the hospitality industry, the agriculture industry and the restaurant industry, just
to name of a few examples (source: U.S. Bureau of Economic Analysis). In comparison, the IT sector is smaller than sectors such as financial services, healthcare, retail and education. On the measure of employment, the IT sector does not crack the
top 10 in numerical terms. However, the IT industry has one of the highest median wages of any sector, indicating a heavy concentration of high-value, high-quality jobs.
What are growth expectations for the IT sector over the next year?
CompTIA uses a consensus forecasting methodology, also referred to as a “wisdom of the crowds” approach. For 2015, CompTIA projects worldwide IT industry
growth of 5.0%, with upside potential of 7.3%. See Section II of this report for more details.
Why does the IT sector matter? Aren’t all industry sectors in the U.S. economy equally important?
All industry sectors in the U.S. economy provide value on some level, or they do not last very long. Some industry sectors, though,
provide value in a way that has a cascading effect, delivering downstream benefits to other businesses and consumers. The technology sector typifies this scenario. Beyond the revenue generated and workers employed, information technology benefits
the entire U.S. economy, helping sectors improve productivity, operate more efficiently and innovate faster. Moreover, because of the relatively high median wage of IT workers, they often help anchor local economies. According to EMSI’s economic
model, computer system design firms have a jobs multiplier factor of about five, meaning every job at a computer system design firm (the term the BLS uses to describe IT services) helps to directly and indirectly support five other jobs in the economy.
Is the number of channel partners growing or shrinking? Industry pundits have been predicting contraction in the channel for some time. While there have certainly been shifts, such as traditional VARs evolving into solution providers or traditional break/fix services firms evolving into MSPs, government data suggest the number of firms that could be classified as channel partners has been relatively stable over the past few years. Even if the Great Recession forced some IT firms to shutdown, new firms have come into existence, leaving the net roughly unchanged. Emerging trends such as cloud and mobility will certainly further challenge segments of the channel universe, which could result in a shake out or consolidation, but so far, that does not appear to be the case. When CompTIA recently asked 450 U.S. IT channel executives about their perceptions of the size trajectory of the U.S. channel, a NET 62% indicate they believe the U.S. IT channel will expand over the next three years, adding companies. Again, as discussed in the channel sizing section of this report, there are certain limitations to developing a precise size estimate of the channel. With the data available, there does not appear to be evidence of growth or contraction in the U.S. IT channel.
What percent of U.S. IT companies conduct business internationally?
According to CompTIA estimates, approximately 1 in 3 conduct at least some business internationally. This may include trade with a single country, such as Canada,
or more extensive dealings across a range of global markets. Large and mid-size IT companies account for the majority of cross-border business.
How have IT occupations performed relative to other types of occupations?
Job growth since the peak of the Great Recession has been stagnant across the U.S. economy. Relative to many sectors, the IT industry has faired well. The
2014 year-end unemployment rate for IT occupations stood at roughly half the national rate. According to Burning Glass Technologies Labor Insights, job postings for IT occupations experienced an uptick toward the second half of 2014. CompTIA’s
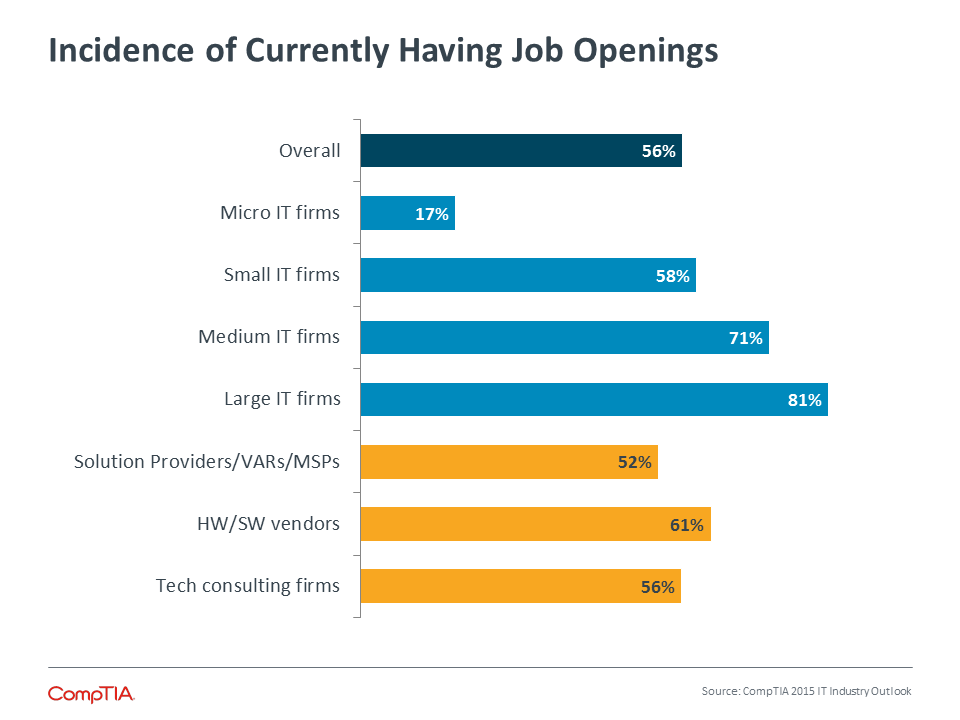
Business Sentiment research indicates a degree of pent-up demand for hiring IT workers. Forty-three percent of U.S. IT companies report having job openings.
How will waves of automation and the rise of the cloud computing model impact employment opportunities for IT workers — negatively or positively?
At this point in the cloud cycle, the answer entails elements of job creation
and job destruction. Additionally, many IT occupations have undergone a makeover, becoming more cloud-focused. Determining the net effect is difficult because of the challenge in isolating the effects of cloud computing versus other factors. Bureau
of Labor Statistics data indicate no significant contraction of occupations most affected by the cloud. The consultancy IDC predicted the cloud will create 7 million jobs during the 2013-2015 timeframe. As noted above, this estimate likely includes
existing positions re-engineered with a heavier cloud focus. As cloud adopters progress towards cloud optimization, evaluating policies, operations and staff capabilities along the way, some will hire new workers, some may shed workers and others
will re-deploy workers. Time will tell how this plays out.
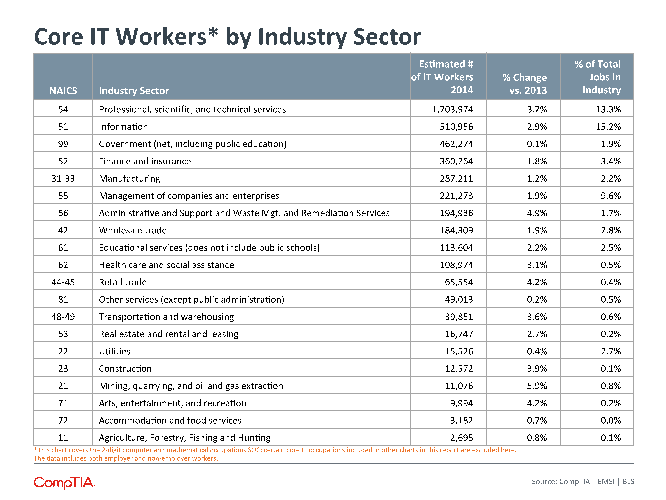
What industry sector employs the most IT workers?
Outside of the IT industry itself, which is the largest employer of IT workers, other sectors that hire significant numbers of technical and knowledge workers include: information,
finance and insurance, government, manufacturing, and management consultants. See table below for more details.
Which states are home to businesses that employ the most IT workers?
The top five states are: California, Texas, New York, Illinois and Virginia. These figures often correlate to the size of the state’s economy and population,
but not always. For example, Massachusetts ranks 14th in population and yet ranks 6th for IT worker employment, primarily due to its Boston-based tech hub.
Does CompTIA have additional market sizing or trending insights on specific product categories such as cloud, mobility or big data?
Yes. The CompTIA research and market intelligence library contains over 100 documents covering a
wide range of technology, channel, workforce and business trends. Many of the reports drill down into specifics on the market size, outlook, growth drivers and related.
How large is the Canadian IT industry? How many IT workers are employed in Canada? What about the UK market, or other international markets?
See CompTIA’s IT Market Summary for Canada or CompTIA’s IT Market Summary for
the UK for these and other details on the Canadian and UK markets. See CompTIA’s International Tech Adoption and Workforce Issues report for coverage of other countries.
What other CompTIA resources are available to help me understand some aspect of the industry, IT workforce or Channel?
For channel-related education and training, a good place to start is the CompTIA Training Catalog.
On the CompTIA website, the Insight & Tools page provides a mechanism for searching through a range of research studies, market intelligence, buying guides and more. For additional state-level
insights on the size and shape of the tech industry or tech workforce, see CompTIA/TechAmerica Cyberstates report.
CompTIA Definition of the Information Technology (IT) Industry
Based on the North American Industry Classification System (NAICS)
INFORMATION TECHNOLOGY (IT) SERVICES
Computer Systems Design & Related Services
541511 Custom Computer Programming Services
541512 Computer Systems Design Services
541513 Computer Facilities Management Services
541519 Other Computer Related Services
Computer Training
611420 Computer Training
Repair Services
811211 Consumer Electronics Repair and Maintenance
811212 Computer and Office Machine Repair and Maintenance
811213 Communication Equipment Repair and Maintenance
MANUFACTURING
3341 Computer & Peripheral Equipment
3342 Communications Equipment
3343 Audio and Video Equipment
3344 Semiconductors & Electronic Components
3345 Measuring, Navigational & Control Instruments
3346 Optical Media and Photonics
SOFTWARE
Software Publishers
511210 Software Publishers
TELECOMMUNICATIONS & DATA SERVICES
Telecommunications Services
517110 Wired Telecommunications Carriers
517210 Wireless Telecommunications Carriers (except Satellite)
517911 Telecommunications Resellers
517410 Satellite Telecommunications
517919 All Other Telecommunications
Internet & Data Services
518210 Data Processing, Hosting, and Related Services
519130 Internet Publishing and Broadcasting and Web Search Portals
519190 All Other Information Services
DISTRIBUTION & WHOLESALE
Wholesale Trade
423420 Office Equipment Merchant Wholesalers
423430 Computer and Computer Peripheral Equipment and Software Merchant Wholesalers
Section 2:
IT Industry Growth Projections
Key Points
- Information technology (IT) industry executives express more confidence in business conditions heading into 2015. CompTIA’s quarterly IT Industry Business Confidence Index increased 2.4 points, the largest gain in two years.
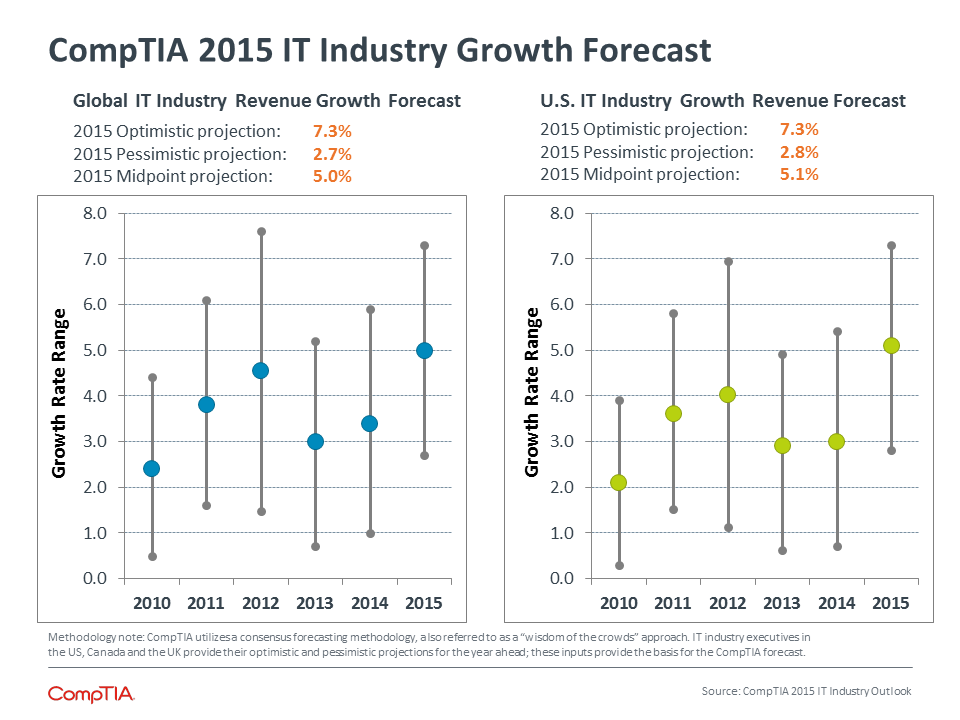
- Consistent with steadily improving business sentiment, CompTIA’s consensus forecast projects worldwide IT industry growth of 5.0% in 2015, a notable increase over the previous year’s forecast of 3.4%. Executives expect the U.S. growth rate to nearly mirror the global rate, while growth in Canada and the United Kingdom is projected to lag slightly.
- The forecast is most bullish for the growth prospects of the IT services category and the software category. The hardware category is projected to grow at a relatively slower rate. Factors such as commodity pricing, the shift from on-premises infrastructure to cloud infrastructure, software-defined-everything and the plateauing of the red-hot mobile devices category contribute to this sentiment.
IT Industry Business Confidence
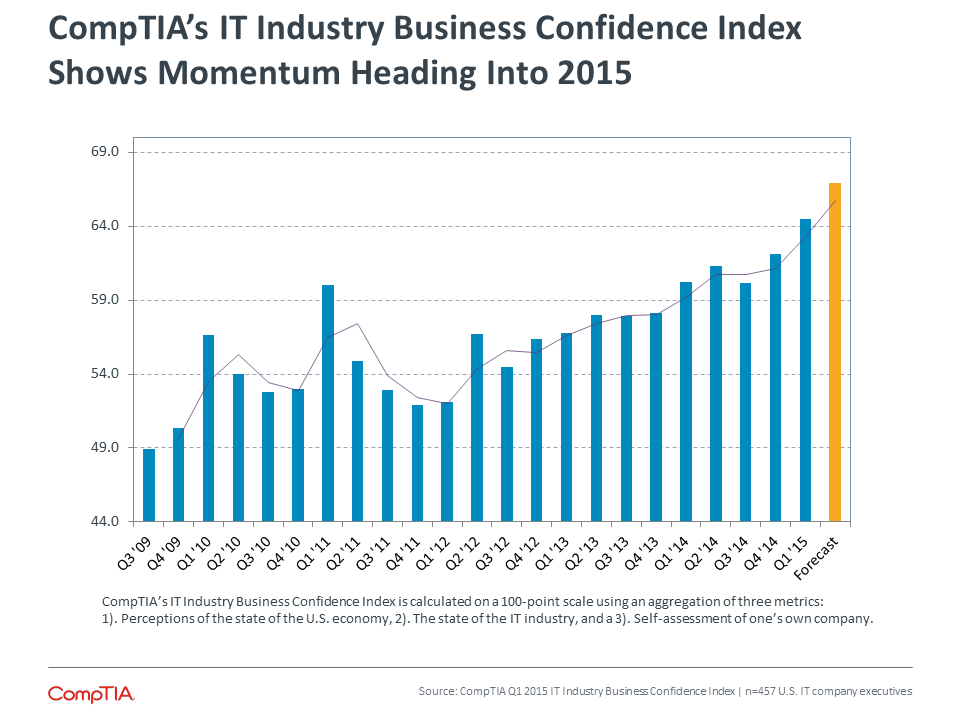
Measures of business confidence provide insight into the state of the economy, business conditions and growth prospects. CompTIA’s IT Industry Business Confidence Index reveals improving confidence on several fronts heading into 2015.
The index increased 2.4 percentage points to 64.5 on a 100-point scale. This puts sentiment at its highest point in the history of the CompTIA index. The forward-looking projection suggests further gains will come during the first half of the year.
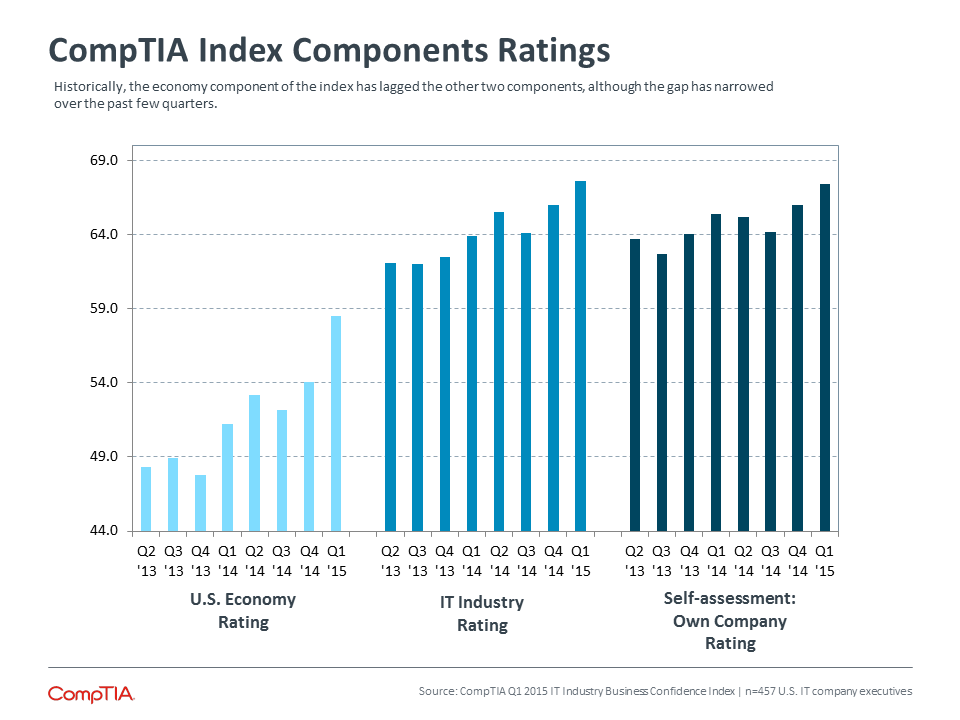
Among the three components of the index, ratings of the U.S. economy continue to lag the ratings of the IT sector and company self-assessments. However, the gap has narrowed markedly on the heels of steadily improving economic fundamentals and strong GPD growth (see following page).
While the IT sector has outperformed many other sectors during the past five years, a fragile economy and nervous customers weigh on business sentiment. No industry sector operates in a vacuum.
A note of caution, the Q1 reading of the index has historically produced gains, which then diminish as the year progresses. This may stem from the optimism many companies experience with the start of a new year.
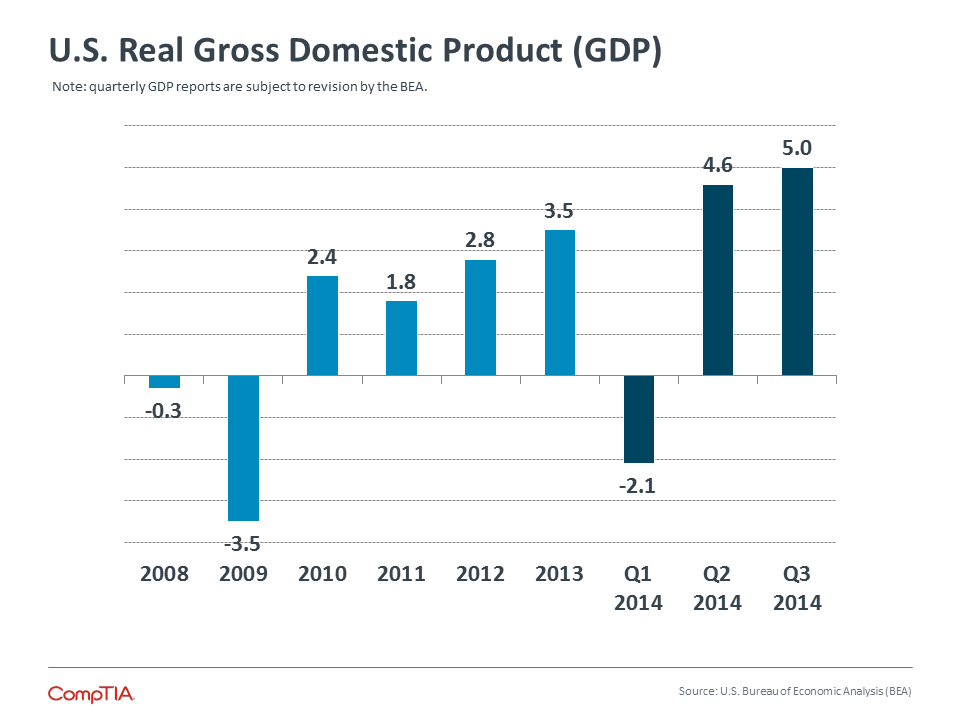
Confidence measures from other sources confirm broad-based economic momentum.
Small Business Sentiment
The Index of Small Business Optimism, issued by the National Federation of Independent Business (NFIB), jumped 2.0 points in December to 98.1, just slightly below its historical average before the Great Recession.
Gains in the Index were driven primarily by expectations for further improvements in business conditions and expectations for sales volume growth.
Consumer Sentiment
The Conference Board's Consumer Confidence Index, which had declined in November, improved in December. The Index now stands at 92.6 (1985=100), up from 91.0 in November. The Present Situation component of the
Index now stands at its highest level since February 2008. The Conference board attributes the gains to more favorable assessments of current economic and labor market conditions.
Manufacturing Sentiment
The Institute for Supply Management (ISM) reported a decrease 3.2 points in its most recent Manufacturing Index, indicating a regression to the 12-month mean in the manufacturing sector. The New Orders Index
also recorded a drop, raising concerns about the manufacturing pipeline. One possible factor is the rising dollar, up 12% versus the euro, making U.S. exports more expensive to overseas buyers. While manufacturing represents a smaller portion of the
U.S. economy than in previous eras, it still commands attention due to its size – around $1.7 trillion, and multiplier effect on other segments of the economy.
IT Industry Growth Forecasts
CompTIA uses a consensus forecasting model for industry growth estimates. This “wisdom of the crowds” approach balances out the opinions of the optimistic with those who are pessimistic, with the intent of yielding a best-fit forecast. Additionally, CompTIA publishes a high-low range, providing insights into the best- and worst-case scenarios for industry growth. During the past few years this methodology has held up reasonably well when compared to actual industry growth rates.
For 2015, CompTIA projects a worldwide IT industry growth rate of 5.0%, with upside potential of 7.3% and a downside floor of 2.7%. The CompTIA consensus forecast is at its highest rate post-Great Recession. There are many moving parts to the global economy and the IT ecosystem, so it is difficult to pinpoint the factors that could lead to hitting the optimistic side of the forecast; or conversely, the pessimistic side.
2015 IT Industry Growth Projections from Other Sources:
Gartner: 3.6% worldwide
IDC: 3.8% worldwide
Forrester: 6.2% U.S. market only
Note: research consultancies tend to update their forecasts periodically to reflect new information, so these figures should not be viewed as static. Additionally, differences in forecasting methodologies, such as positioning in current or constant dollars, should be taken into account.

IT growth expectations for the U.S. market mirror the global forecast. These projections are generally consistent with the IMF’s GDP forecast for the U.S. market in 2015. The IT sector consistently outperforms GDP growth, a trend expected to continue in the year ahead.
CompTIA’s industry forecast covers revenue only in current dollars, which makes it sensitive to pricing factors. The effects of inflation can impact the perceived value of goods sold from year to year. Additionally, there may be scenarios where unit sales, of tablets for example, may increase significantly, but if the average selling price falls, resulting revenue growth may be flat. Currency fluctuations may also play a more prominent role in 2015.
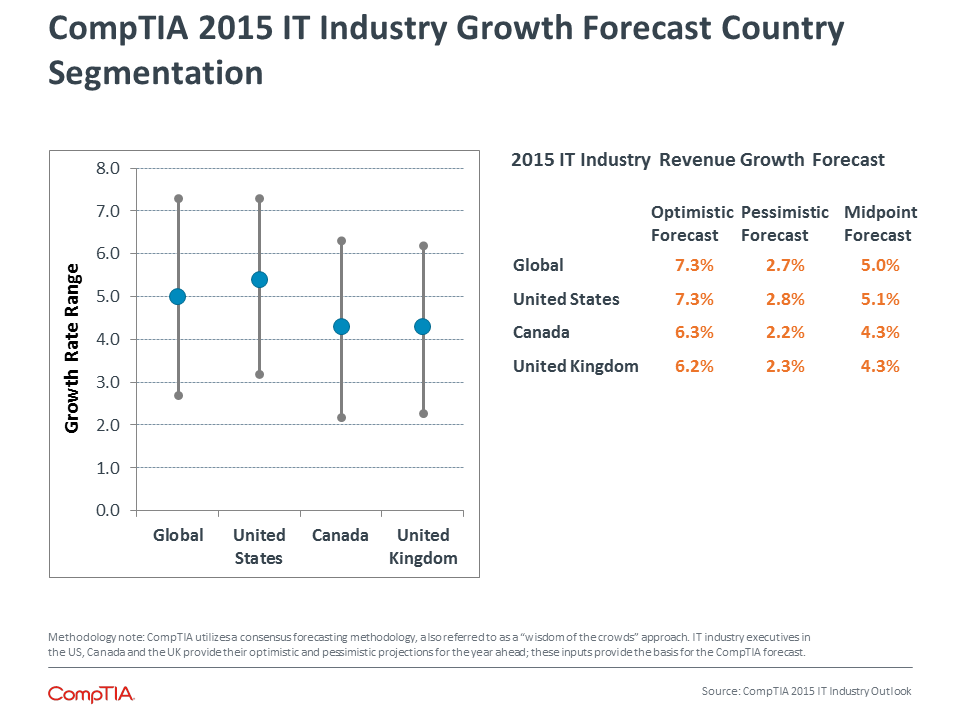
To complement the global and U.S. forecasts, CompTIA included two additional forecasts this year: Canada and the United Kingdom. Using the same consensus methodology, executives from Canadian and British IT companies provided their views on industry growth in the year ahead.
Interestingly, the results are identical, with each country yielding a projected growth rate of 4.3%. For context, the IMF projects a GDP growth rate for Canada of 2.5% and 2.7% for the United Kingdom.
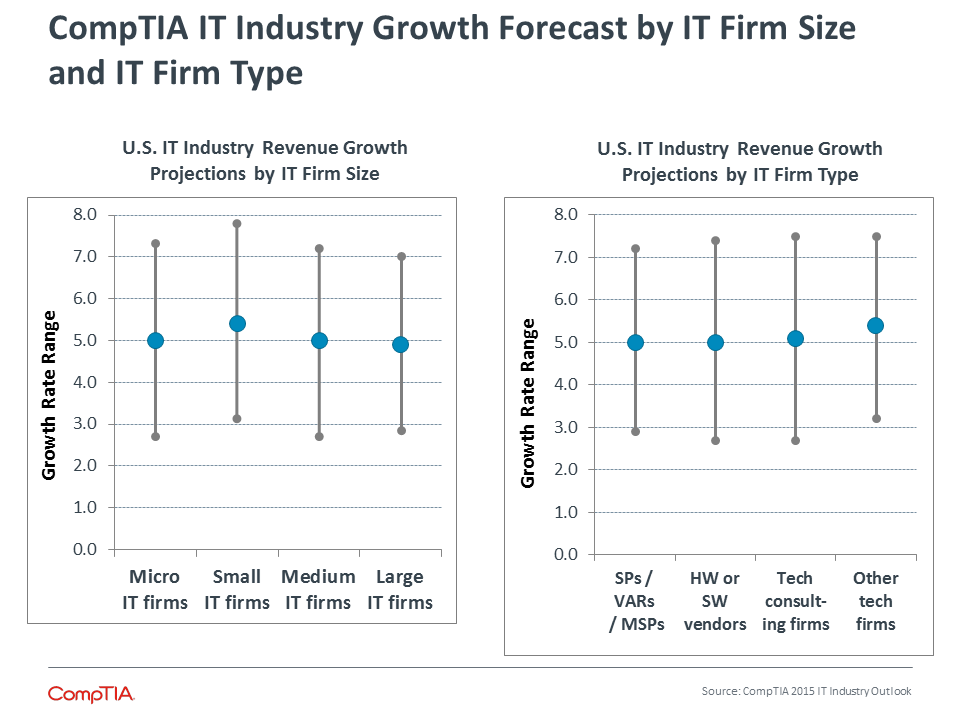
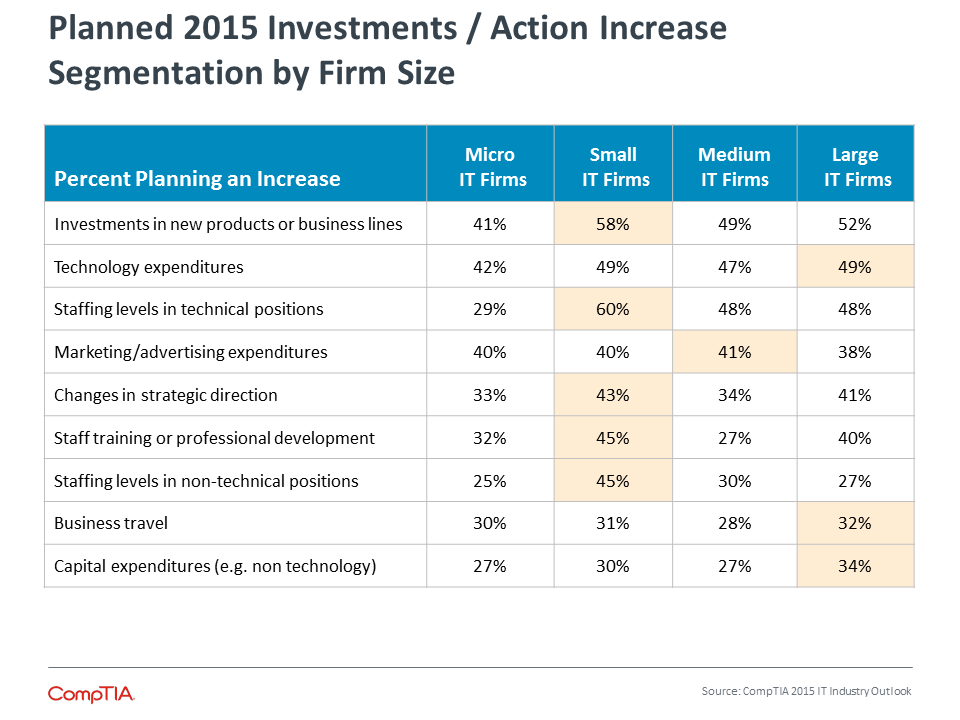
When analyzing the U.S. results by company size, the data reveals few differences. Unlike business confidence, where micro-size IT firms (under 10 employees) recorded slightly more bearish sentiment, companies across the size spectrum share nearly identical opinions about growth prospects for 2015.
The similar pattern exists for the data segmentation by company type. Solution providers, VARs, MSPS, vendors, consultants, telecom providers and distributors appear to share approximately the same industry growth outlook for 2015. Keep in mind, averages can be skewed by extreme optimism or extreme pessimism. When viewing the median, the data suggests solutions providers and consultants are slightly more bullish about the year ahead than vendors and telecom service providers.
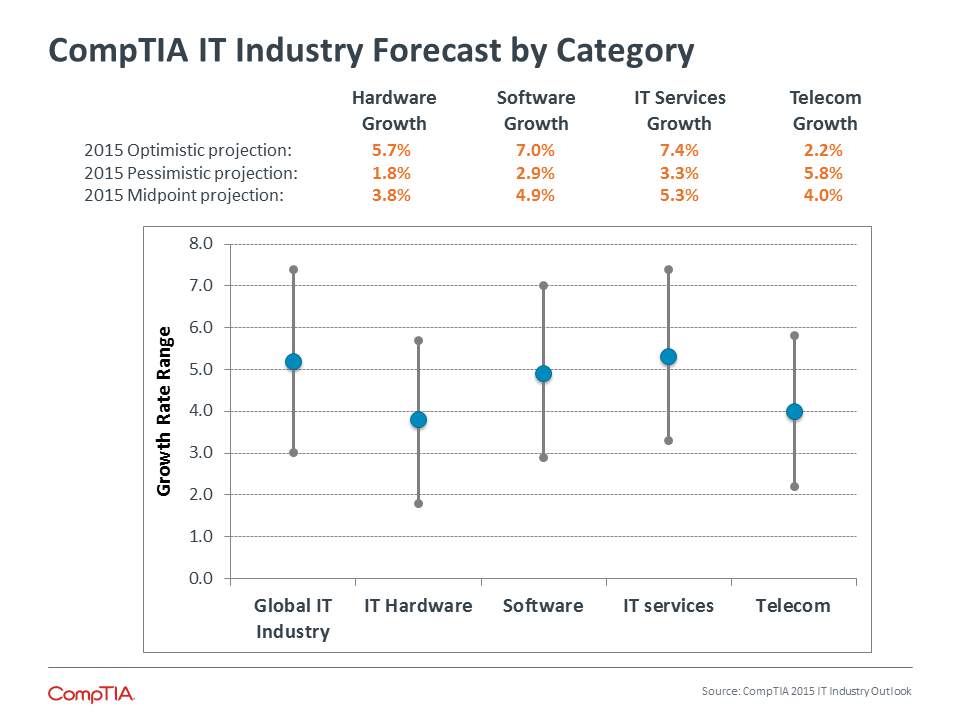
Using the standard product classification framework for the IT sector, consisting of hardware, software, services and telecom, additional insights can be gleaned from the data. Consistent with last year’s forecast, IT services are projected to grow at the fastest rate. IT services often have the potential to command higher margins, customer stickiness, and add-on sales opportunities, making them attractive to tech firms small and large. The “everything-as-a-service” phenomena has captured wallet-share and mind-share across all four categories within the classification framework.
Marc Andreessen’s famous quip, “software is eating the world” continues to hold true. Software increasingly sits at the heart of an ever-expanding range of business operations. CompTIA forecasts midpoint growth at just under 5% with upside potential of 7.0%. While demand for software remains strong, customers increasingly have a range of options, including open source solutions, lower cost alternatives to traditional enterprise applications and freemium solutions, such as freemium online storage. These dynamics are generally good for customers and innovation, but inevitably there will be revenue winners and revenue losers.
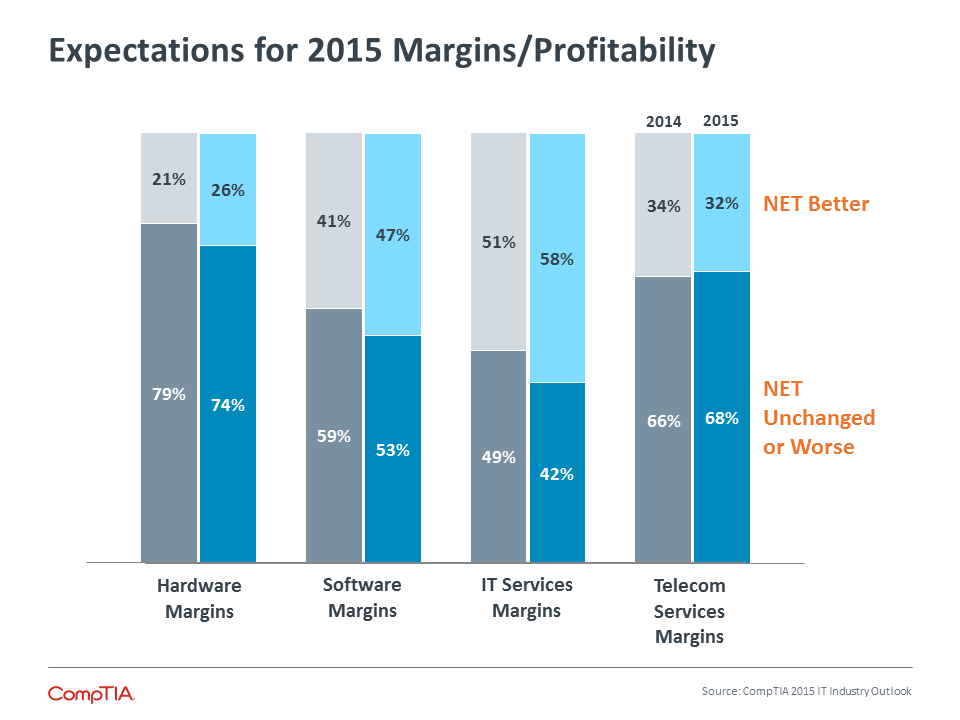
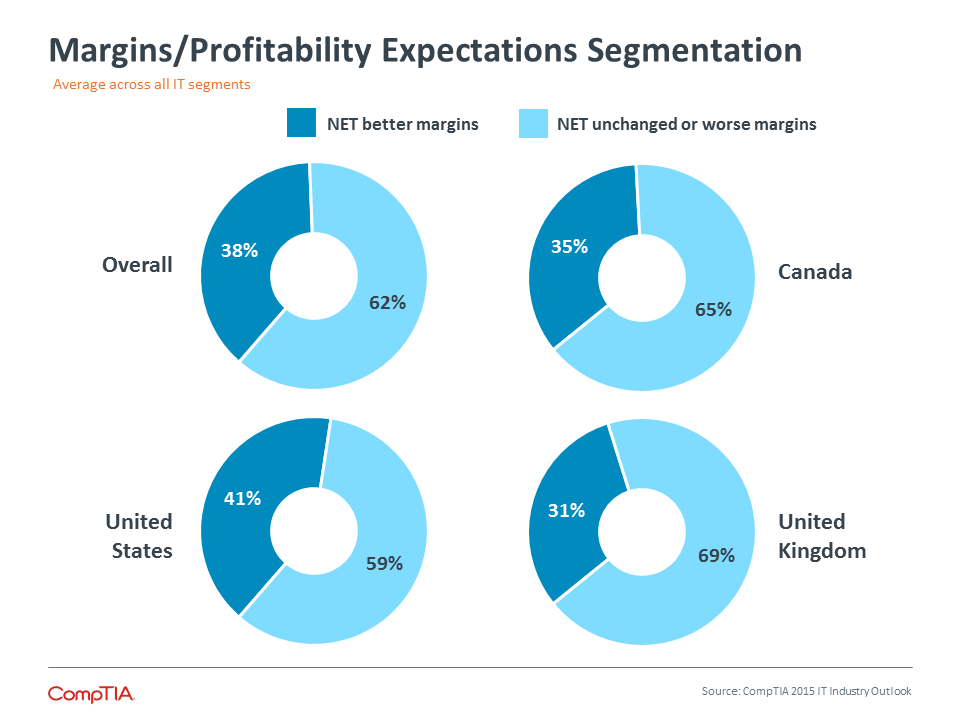
The hardware segment is projected to grow at the slowest rate. Factors such as commodity pricing, the shift from on-premise infrastructure to cloud infrastructure, the plateauing of the red-hot mobile devices category, contribute to this sentiment. IT company executives express the most concern over deteriorating margins in the hardware category – a NET 74% believe margins will worsen or remain constant, compared to only 26% that expect improvement. See Appendix for margin expectations by country.
Telecommunications also received a somewhat lukewarm forecast. Wireless and data services remain strong, but in many ways can be thought of as mature markets – just about any business or consumer that wants some type of telecom service already has it. Some telecom providers have had success moving into cloud services, managed services or security, for example, but typically these revenue streams represent a small percentage of their overall revenue stream. Even though large telecom providers have deep pockets and extensive customer bases, moving into new service areas is never easy. Expertise must be developed, sales teams retrained, customer trust earned and a host of other issues resolved before a company can attain the desired level of traction and profitability in a new market segment.
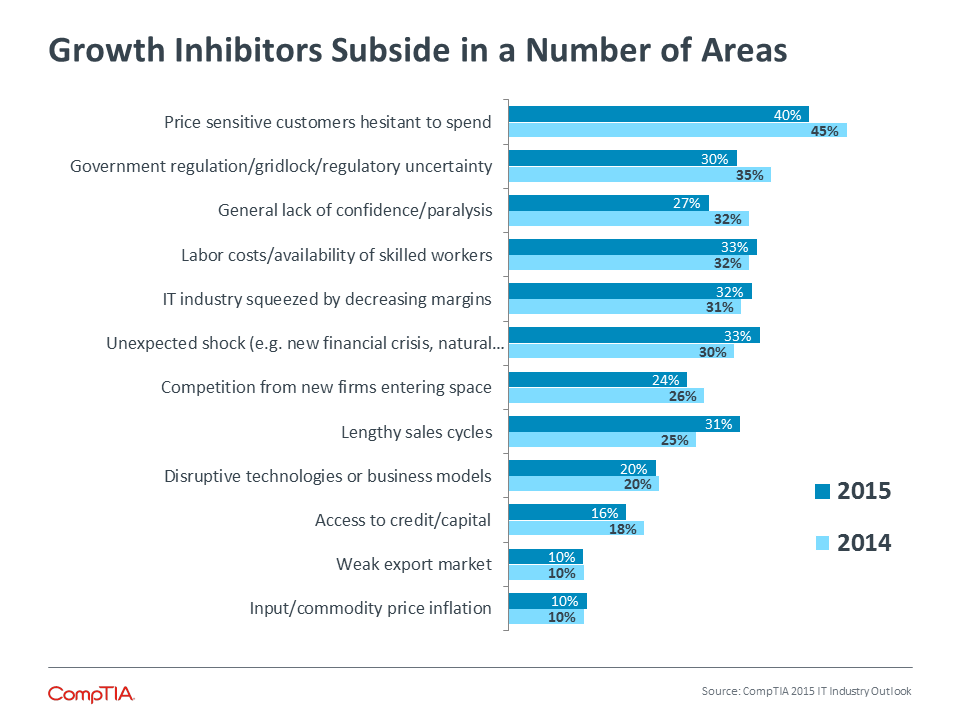
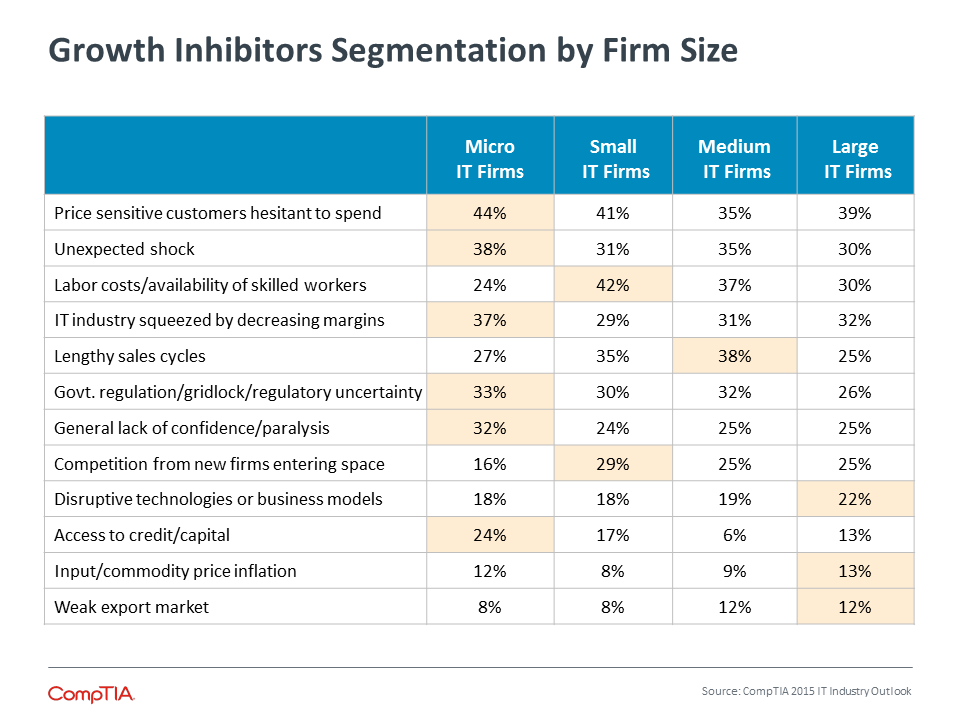
Despite upward trending business sentiment and the highest growth forecast in years, industry executives remain concerned about the ever-present growth inhibitors that can quickly stall momentum. Compared to last year, executives are slightly less concerned about spendthrift customers, government regulation/gridlock/regulatory uncertainty and a general lack of confidence. The data suggest a slight uptick in concern over unexpected shocks such as a new financial crisis (domestic or abroad), natural disasters, terrorist attacks and related “black swan” events. Additionally, concern over lengthening sales cycles, which can be problematic for cash flow, increased slightly as well.
As expected, micro-size IT firms – those with fewer than 10 employees, express more concern over growth inhibitors compared to larger companies. The very smallest of firms typically have more customer concentration risk and have fewer resources to cushion the blow from unexpected shocks. One in four micro company executives indicate access to credit and capital continues to be an issue. See Appendix for additional segmentation detail.
Section 3:
Technology and Channel Trends
Key Points
- At a macro level, the year ahead will once again feature the usual mix of optimism, progress, uncertainty and regressions. The amazing pace of innovation over the past five years will deliver new benefits to untapped users around the world, small businesses and other non-early adopter segments. Businesses and users of all types will continue to seek value from technology in the form of capabilities, but also in its ability to reduce complexity rather than add to it. In the backdrop sits the ever-present hand of government policymakers. In an increasingly inter-connected world the stakes have never been higher for tech policy.
- From a technology standpoint, many of the trends from previous years will enter a new phase of maturity in 2015. Businesses will begin using cloud and mobile to build advanced systems. The ability to manage data will become a critical and highly demanded skill. The potential of many connected devices and sensors will lead to new areas of opportunity. And over it all, security will have to change as technology evolves to drive new business prospects.
- For the IT channel, 2015 stands to be the year to really up its game. Business transformation will remain the buzz word of the moment as channel firms of all stripes continue to assess the direction of their companies in the age of cloud computing, mobility, managed services, big data, social media and other market and technology forces. Navigating new routes to market and evolving customer buying habits will challenge channel firms to focus just as much on their own branding and marketing as they will on elevating their tech skills.
Overview
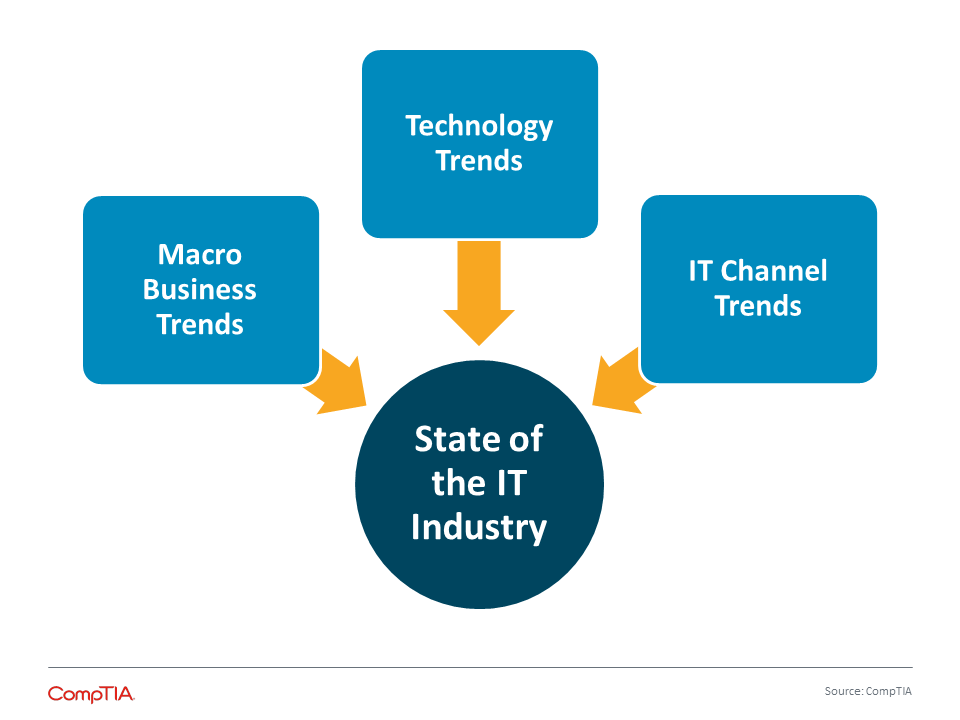
The interplay of macro business trends, technology trends and channel trends shape the information technology (IT) landscape in the short-term, while setting longer-term developments in motion.
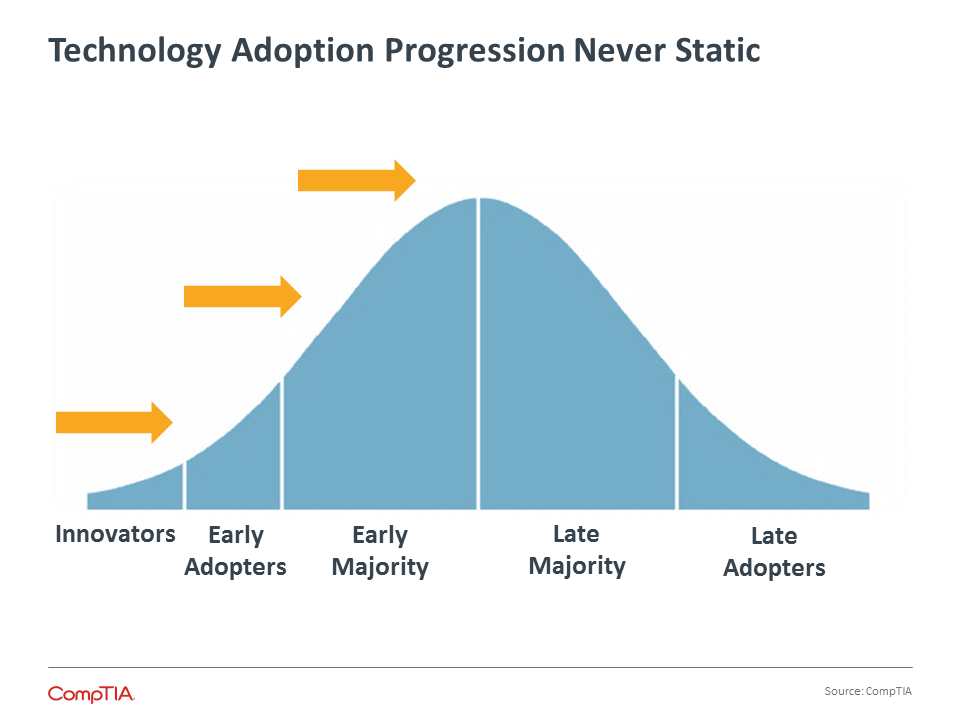
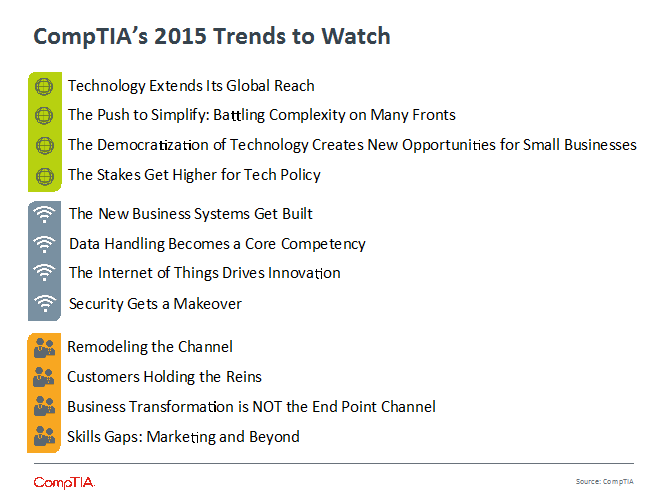
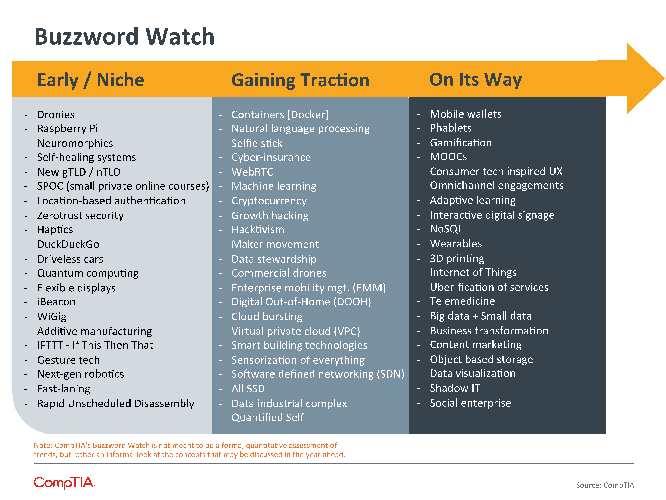
Building on Sections 1 and 2 of this report, CompTIA views 2015 as another year of momentum and continuation, as incremental advancements in a number of areas make their mark on the IT industry and broader economy. Notable disrupters, including cloud, mobility, social, workforce automation, big data and the Internet of Things will continue to shake things up. Some innovations will begin to move beyond the early adopter stage, gaining market share and new users. Lastly, some innovations are fun to talk about and fun to look at prototypes, but are still many years off before reaching any meaningful adoption or contributor to overall revenue.
When compiling trends lists, prognosticators sometimes fall into the trap of over-hyping the future, while understating the present. Trends take time to progress through the stages of adoption – often taking longer than many expect. The year ahead will certainly feature its share of surprises, but realistically, it will be one of evolution and progression, rather than revolution and quantum leaps. To ensure a balanced approach to the future and the present, CompTIA will present key trends, as well as “counter trends,” factors overlooked, taken for granted or counter to prevailing hype.

Macro Trends
Technology Extends Its Global Reach
Trend: Globalization, driven largely by technology, becomes ever more pervasive and influential with each passing year. The number of people with access to the Internet recently crossed the 3 billion threshold, representing 42% of the global population, according to Internet World Stats. Less than two years ago, U.S. websites accounted for 9 of the top 10 slots worldwide. Estimates now suggest the list includes far more international representation with sites such as Alibaba, Baidu and Tencent capturing huge market shares. Similarly, U.S. technology companies maintain a hold on many of the top slots in hardware, software and IT services. Although this too may change as new generations of global-minded entrepreneurs seek to make their mark.
Drivers/Opportunities: The same factors that drive many of the trends discussed in this report are also at play globally. Ever-lower prices for computing power, storage and broadband, coupled with open (or mostly open) platforms to develop applications for communications, information, commerce, entertainment and a host of other outputs designed to improve personal or work lives. Given network and multiplier effects occurring between and within countries, the value and benefits of technology will only grow. It stands to reason there will be many opportunities. There will also be intense competition coming from all directions and the usual uncertainty associated with international markets.
Counter Trend: In the face of relentless innovation, the trend towards further tech-driven globalization seems inevitable. However, a number of counter weights could slow or stall momentum. After seeing numerous industries disrupted by technology, governments in some countries may opt to pursue polices to protect workers, even if it means foregoing innovation that benefits society at large. State-sponsored spying, hacking and espionage became a front-and-center issue this past year with a number of chilling examples. It is tough to predict the impact of these incidents, but it is not hard to imagine scenarios involving more restrictions, barriers and tech fatigue. Lastly, in developing markets, infrastructure could be a factor. Inadequate or unreliable sources of electric grid or battery power limit a country’s ability to move up the technology adoption curve.
The Push to Simplify: Battling Complexity on Many Fronts
Trend: Albert Einstein famously said, “make things as simple as possible, but not simpler.” CompTIA research consistently shows a strong desire among businesses of all types to simplify their operations, supply chains, workflows, internal communications and many other areas of the organization. While tools and strategies exist to help businesses simplify, the data suggests relatively few firms have achieved Einstein’s vision. In some situations, business digitalization technologies get too far ahead of people and process. Overcoming the inertia of entrenched mindsets, bureaucracy, legacy investments and uncertainty is incredibly difficult for any organization.
Drivers/Opportunities: Since the Great Recession, the “do more with less” mentality has dominated corporate strategy. This undoubtedly led executives to pursue strategies such as simplification with the end goal of cost cutting in mind. It should be noted that while simplification often goes hand-in-hand with cost cutting and the elimination of waste, it is not always the case. Simple, elegant solutions that are embraced by workers and customers alike typically require much more than trimming fat at the margins. Another factor driving the renewed push to simplify stems from innovations, such as cloud computing, mobility, business process automation (BPA), managed services, big data and other developments that have given businesses unprecedented access to tools to support simplification efforts. For IT companies, opportunities lie not only with implementation, but also with providing a true consultative experience to their customers. Simplification may take the form of helping CIOs shift from maintenance mode to innovation mode, helping to balance the security needs of the organization and the needs of workers, or helping customers navigate the sometimes overwhelming number of technology options.
Counter Trend: Movement along the simplicity-complexity continuum often involves tradeoffs. Consider one very simple example: a company seeking to boost employee productivity may seek to streamline meeting time, email communications and other activities where there is perceived waste. This may boost productivity, but it may also cut into the social interactions that allow employees to form relationships, which if diminished, may actually be counterproductive. In more complex scenarios, technology may be so effective at reducing complexity that workers or entire industry sectors are displaced. Of course, this typically leads to demand for new types of workers and the emergence of new industries, but it can be difficult to assess these effects while change is underway – the “uber-fication of services” is one notable example of this phenomenon.
The Democratization of Technology Creates New Opportunities for Small Businesses
Trend: Technology has never been more accessible to small businesses. The democratizing effects of technology are visible everywhere. The small retailer using mobile payment technology and powerful marketing automation applications. The small manufacturer using rapid prototyping tools and managing sophisticated supply chains. The small law practice using document management applications and advanced text analytical tools. The startup using cloud-based infrastructure and “rent-a-coder” services. These simple examples highlight the many ways technology has leveled the economic playing field, giving small businesses the means to launch, scale and compete.
Drivers/Opportunities: Many applications and devices designed for the consumer market quickly find their way to the small business market. This may be a function of free or freemium pricing, or the appeal of user-friendly designs. Small businesses with limited IT expertise will gravitate towards applications they can manage themselves, even if it means possibly foregoing advanced capabilities or security safeguards. There are approximately 7 million business establishments in the micro category (under 10 employees) and another 1.8 million in the small category (10-99 employees), accounting for 98% of all business establishments with payroll in the United States. Not to mention, there are tens of millions of self-employed and sole proprietors excluded from government business establishment counts. The enormous size of the small business customer base makes it an appealing market. With the “everything-as-a-service” model, technology providers now have better mechanisms to provide tiered offerings, giving small business customers affordable, pay-as-you-go access to advanced technology.
Counter Trend: The democratization of technology has narrowed, but not eliminated the digital divide among businesses. Small businesses continue to lag in many areas of digitalization. Making progress will require some degree of expertise, which presents a challenge for small firms that have to compete for tech talent. Additionally, because of the growing importance of ecosystems and platforms, the creators of these systems hold significant power. Small businesses almost always react to these forces rather than proactively drive them.
The Stakes Get Higher for Tech Policy
Trend: Government policies and regulations have always been part of the tech landscape. Historically, rule making lagged the pace of innovation. Moreover, the focus of rule making has mostly been confined within borders. With greater global inter-connectivity, even faster rates of innovations and a tech sector that influences ever-greater portions of the economy, the stakes of tech policymaking are getting higher. Cybersecurity, privacy, data ownership, net neutrality, patent trolls, creative destruction, state-sponsored hacking and espionage, the right to be anonymous, backdoors, and training and certifying the workforce of tomorrow are just some of the key areas of tech policy with far-reaching ramifications.
Drivers/Opportunities: Recent innovations and developments have strained many tech policies designed during prior eras. The depth and breadth of issues at hand can be overwhelming. While policymakers and government regulatory agencies often recognize issues that require attention, there are now so many moving parts and so many stakeholders, that action becomes incredibly difficult.
Counter Trend: When it comes to tech policy, there are rarely perfect solutions. When the stakes are so high, it can lead to parties unwilling to compromise. Or, the issues may be so complicated and the unintended consequences of tech policy so difficult to predict, that it results in paralysis. Government policymakers tend to be on the receiving end of criticism, but private sector companies often find themselves playing multiple sides of an issue to hedge their bets against an uncertain future. Users are sometimes equally unpredictable. For example, voicing outrage at new terms of service on a social platform they use for free, but then quickly forgetting about it as they use the new feature.
Technology Trends
The New Business Systems Get Built
Trend: It’s impossible to talk about IT without mentioning cloud and mobility. In the past several years, these two trends have driven new spending and new skill building, and now organizations are poised to take the next step forward. Instead of viewing these topics as individual projects, businesses will start thinking about how the overall operation of their IT function will change as a result of cloud and mobility. The overriding goal of IT has always been to build business systems that support organizational goals, and now those systems must drive goals forward in an environment fueled by technology.
Drivers/Opportunities: The development of technology for the consumer market has changed perceptions around user experience, accessibility, and availability; new business systems must take these perceptions into account. As companies move their cloud computing efforts from narrowly focused migrations to broad architectural plans, the placement of applications will get more focus. Multi-cloud management will be a challenge that many firms need to solve, and the use of containers to improve portability will add a new layer to the application stack. Business units will be expecting IT to use these tools to make the cloud easier to use, tying those systems to mobile applications that improve workflow and results.
Counter Trend: While the new business systems are being built, there are still countless legacy systems that need to be supported. The rapid rise of cloud providers and mobile devices has been newsworthy, but most companies do not have the luxury of rebuilding their infrastructure overnight and prefer to wait until there is some sort of forcing function. These companies still require on-premise system maintenance, support for older applications, and device management. Even those companies moving more aggressively will have some sort of transitional period, where traditional support activities are needed alongside cutting-edge technology direction.
Data Handling Becomes a Core Competency
Trend: As the debate has raged over the definition of “Big Data,” the net effect has been that more and more businesses are considering the way that data is used in their organization. The conclusion? Data is not just an important part of business—many firms consider it to be their most critical asset. This resource can deliver historical insights, describe the current state of affairs, and maybe even predict the future…if it’s handled properly. That handling involves a wide range of activity, from collection to analysis and visualization. Instead of viewing data simply as the result of business operations, companies will start viewing it as an end unto itself and building up the discipline to get the most out of it.
Drivers/Opportunities: New technology in the hands of businesses and consumers is generating massive amounts of data: according to IBM, the total amount of digital data in the world doubles every 18 months. More importantly, new tools and computational abilities now allow companies to collect and analyze unstructured data, which makes up the majority of the total volume. Data analytics is not a new activity, but it’s being taken to new levels and being adopted by many companies that have typically not viewed data as a key part of their business. New data skills are a complement to the new business systems, as more applications and workflows are “designed for data,” with components that focus on data security, privacy, or usage.
Counter Trend: Many companies need to establish good data management before moving to more advanced activity. A large number of SMBs have fragmented data in the organization and do not use any tools more sophisticated than a spreadsheet for collection or analysis. Rather than jumping right into the latest and greatest, these firms will benefit from well-established data tools, and the availability of these tools in the cloud will help drive implementation. Additionally, the focus on data tools does not replace the need for analytics skills; “data scientist” is a term that often implies complex data handling, but the application of business knowledge and intuition is needed at every level. Companies will have to exercise some patience as they build these skills—many organizations are starting to see pushback as data requests exceed current capabilities to deliver.
The Internet of Things Drives Innovation
Trend: The technology industry and businesses in general love to fixate on the next new thing, and the Internet of Things (IoT) became the focal point of many discussions in 2014. As with any hot topic, it has been met with some amount of skepticism, but in this case the hype is justified. The Internet revolutionized the way we share information, and the Internet of Things promises to revolutionize the physical world in the same way. The ability to collect data from new sources and automate activity within a system will help companies not only do current business better but also find new business models and revenue streams.
Drivers/Opportunities: In general, IoT is enabled thanks to shrinking technology and shrinking prices on that technology. The ability to place sensors, compute capabilities, and networking on any object creates a brand new platform for software and for the services that will ultimately provide the most accessibility and value in this trend. It will take some time for those services to come to the forefront, and it will also take some time for the development of standards and protocols to make IoT truly viable. Those activities will move forward quickly in 2015, and business on the leading edge of this wave will be bringing any developments to bear on their bottom line.
Counter Trend: In many ways, IoT is simply a logical extension of recent forays into cloud computing, mobility, and big data. As such, companies need to make sure they have a strong foundation in these areas. You need to walk before you can run, and businesses that have been slower to adopt technology trends over the past five years will have some work to do before they can take off with IoT. Education will be a major part of these efforts, and IoT creates an opportunity to show how cloud and mobile components can be used to create something new rather than simply replace existing systems.
Security Gets a Makeover
Trend: As business systems are transformed, data becomes the currency of business, and everything everywhere gets connected, security will be even more of a focal point than ever. With traditional security measures proving woefully inadequate, new tools and tactics will begin to emerge. Biometrics, in-app security, contextual cues, and proximity awareness will play a much larger role in security design, and companies will have to be aware of these items even as they are also implementing new tools such as data loss prevention (DLP), identity and access management (IAM), and security information and event management (SIEM). On top of all this, privacy will become a branch of security that requires specific attention as everyone worries about what is being done with their data.
Drivers/Opportunities: The IT headlines in any given week provide proof that the industry hasn’t solved security, but the stakes are higher than ever. The October 2014 Global Report on the Cost of Cyber Crime conducted by the Ponemon Institute found that the average annual cybercrime cost at $7.6 million per company. This average is skewed high by large enterprises, but the study also found that the per capita cost for the smallest businesses was significantly higher than at the largest firms—$1601 vs. $437. With attacks on all sizes of business rising sharply, the risk to both business operations and reputation is too great for anyone to ignore.
Counter Trend: Traditional security measures are no longer sufficient, but they also cannot be abandoned. Perimeter security, anti-virus, and physical security are all still valid, and in many cases they should be updated. Modern firewalls are application aware to help detect behavioral anomalies, and many security applications now benefit from being delivered via the cloud. Keeping these systems strong while improving the security awareness of the workforce will provide the necessary foundation as new security techniques are incorporated.
Channel Trends
Remodeling the Channel
Trend: The days when the IT channel constituted a firmly set midpoint in a linear chain linking IT products from manufacturer to end customer is becoming less of a given. It’s not that the traditional channel is irrelevant, but rather that it is no longer monolithic, nor defined by one type of business model or supply chain position. Technology routes to market today are diverse, filled with many players and crisscrossing paths that shuttle solutions from Point A to Point D. And with the industry blossoming into a multichannel maze, conventionally structured channel firms must rethink their underlying business model and reconsider their interactions with vendors, distributors, customers, competitors and each other.
Drivers/Opportunities: Cloud, mobility and other technology trends are contributing factors in the fragmenting go-to-market model that the channel has hung its hat on for so long. Cloud and mobility each enable more direct delivery to customers, whether it is the push variety – vendor to customer – or of the pull sort, in which end customers determine what they want and self procure products, apps or services from the cloud. These developments don’t eliminate the need for an IT channel, but in many ways lessen the focus on reselling and moving product from distribution to end customer. Increasingly, regardless of how the underlying IT is bought, sold or delivered to market, channel firms will find it smart to adopt the role of influencer in the buying process.
Counter Trend: While market forces are expanding the ways IT gets to the customer, the channel as a conduit is not going away anytime soon. North of 90% of U.S. IT channel firms are small, less than $10M in revenue and often closer to $1M. They sell to SMB customers that typically lack an in-house tech staff and rely on a channel firm to handle their IT needs, which includes selling them products they need. Meanwhile, larger companies that purchase IT through a formal, internal procurement department may be required to remain tethered to traditional means of sourcing by various regulatory mandates.
Customers Holding the Reins
Trend: The customer is king the axiom goes. That’s never been truer than it is today, and it will remain the prevailing dynamic in the years ahead. End user customers are more tech-savvy than ever, and for a variety of reasons they are armed with considerable leverage in the IT buying process. Access to reams of online information on pricing, consumer reviews and transparency into the options for acquiring IT have imbued a new generation of customers – both tech- and business oriented – with a higher degree of know-how when it comes to tech shopping. That means the channel will have to adapt in how it sells to and works with these IT buyers.
Drivers/Opportunities: It’s a recurring theme, but cloud and mobility play an unmistakable role in fostering today’s customer power-position in the tech-purchasing arena. Think about the widespread use of smart phones, mobile apps and social media as a basis for the kind of tech acumen that many consumers feel they bring to the table today. Couple that with their access to practical product- and solutions information (online pricing, availability, etc.) and you have an empowered base of buyers. Working with younger generation customers, in particular, presents a different dynamic for channel firms. They know what they want to buy upfront in many cases – though they might not buy it from you – yet they display a desire to work collaboratively, partnership-style, with their IT providers on the use of those solutions. Customer service is critical to them. Non-IT professionals are also upping customer clout. More commonly, individuals such as a VP of marketing are making major IT decisions for their departments, requiring a different type of marketing outreach and sales conversation than selling to the IT department.
Counter Trend: While customers have become more knowledgeable about technology in general, the fact is that most are not versed in more comprehensive IT, including back office infrastructure, data-intensive and analytics solutions, security and networking solutions. And there’s the integration piece of it all, including tying on-premise systems to any solutions that reside in the cloud. Point being? Customers may have leverage in the buying discussion and price sensitivity will always remain a factor, but for many buyers, getting the most optimum use out of their technology is going to mean tapping the services of channel or other IT professionals.
Business Transformation is NOT the End Point
Trend: Business transformation is the buzzword du jour in the tech industry. Nearly 8 in 10 U.S. channel firms say they have experienced some transformative activity to date, which could include moving from transactional product sales to recurring revenue, embracing a new cloud portfolio, gaining vertical industry expertise or becoming a managed services provider. The problem is that many channel firms stop short there. They add a single cloud service to their portfolio or put some clients on a pay-as-you-go contract and deem that business transformation. But the fact is that those steps are just the beginning; the concept of transformation is the start line, not the ending point. Changes to sales, marketing and other operational functions are crucial to a fully realized alteration. Adding a single managed service, for example, is simply a first step of many to becoming a firm that sells deep into the digital services space.
Drivers/Opportunities: Plenty is driving channel firms to sit up and take notice of the potential benefits of reorienting business around services, cloud, consulting and recurring revenue models. Steady margin erosion on product sales, new competitor types, shifts in IT procurement and delivery models, and customer choice all factor in to the desire to change. Reacting to these and other drivers should be a continual work in progress, not a moment in time, for companies that want to improve on a consistent basis.
Counter Trend: Transformation implies complete change. Yet the reality is that many channel companies will choose, for reasons either deliberate or inescapable, to remain with feet in both the old and new worlds. They will dabble in some of the newer business models like cloud, but also continue to maintain and nurture the legacy pieces of their portfolio. This hybrid model will exist in the channel out of necessity as these mainly SMB companies can nary afford to shed conventional revenue lines completely, needing to continue to make payroll, keep their utilities running and foster positive cash flow.
Skills Gaps: Marketing and Beyond
Trend: Training and hiring – both business and technical—is going to occupy a huge piece of the channel’s time and budget in 2015 as firms struggle to get the right people to take on more complex technology areas (cloud, mobility, app dev, big data) and to sell effectively to the non-IT line of business buyer. One of the primary skills areas that will draw attention from channel firms with an eye on the future is a new focus on marketing effectiveness. Marketing as a functional area has never been a strength for the channel majority. The natural focus has been on the technical foundation of these businesses in addition to sales activities. Yet to date, the lack of marketing devotion has largely gone unpunished, mainly because the channel historically has derived its market identity through the vendors they resell. In other words, their branding has been draped in their affiliations, whether it’s Microsoft, Cisco, Oracle or HP. That reality is changing.
Drivers/Opportunities: As the nature of cloud solutions tucked away in a few large data centers diminishes the relevance of vendor brand to end customers, channel firms are going to have to put much more effort into branding themselves. As cloud abstracts the underlying products and solutions from the customer, the channel firm and its reputation and expertise move to the front lines. The use of social media, more intuitive and impactful Web sites and messaging that emphasizes value proposition versus status within a certain vendor’s partner program are the necessary marketing tools the channel will need to embrace.
Counter Trend: The importance of vendor brand isn’t dead. For channel companies selling into particular verticals, vendor brand and the achieved level of expertise working with said vendor’s products will continue to be crucial to winning business. Think specialized areas such as CAD/CAM or even healthcare IT niches like EMR applications.
Appendix
2014 Trends
- Technology Becomes a Core Competency for More Businesses
- Mass Customization Gets More Sophisticated
- Processes and Workflow Get a Makeover
- Technology Increasingly Embraced as the Remote Control of Life
- Cloud Wars Intensify
- Diverse Devices Flood the Market
- Big Data Has a Little Sibling
- Software’s Appetite is not Satisfied
- When It Comes to Your Channel Business, It Can be OK to Stay in Two Lanes
- Time to Rebrand the ‘Trusted Advisor’
- Back to the Basics: Reinvesting in Technical Expertise
- Channel Dynamics: Partner or Competitor?
2013 Trends
- Progress Along Innovation Learning Curve Pays Dividends
- Expectations Reset: The Push for Faster, Larger, Easier and Safer
- Open and Transparent Further Displaces Closed and Hidden
- The Distributed Economy Deepens
- Technology Continues Its Transition from Supporting Tool to Strategic Driver
- Mobility Becomes a Way of Life…for Employees and Customers
- Companies Begin Taking Cloud Computing for Granted
- The Big Data Phenomenon Will Force Companies to Review Data Practices
- Communications and Collaboration Get a Boost from the Cloud
- Managed Services: Upping the Game
- Navigating the New Channel Ecosystem
- Specialization: Tackling Growth Markets
- Convergence Creates Strange Bedfellows
2012 Trends
- Disintermediation – the Drive to Simplify
- Automation Pushes Into New Areas
- The Enterprise Digital Divide
- The Ever-Shifting Regulatory Environment
- Employees On the Go…Expect Their Data to Follow
- Cloud Computing Expands IT Department Toolbox
- Social Tools and IP Communications Change Collaboration
- Everything Gets an IP Address
- Business Transformation: Evolution or Revolution?
- Vendor-Channel Relationship: Show Me the Love
- Specialization: Blessing or Curse?
- Considering the Customer
About this Research
CompTIA’s IT Industry Outlook 2015 provides an overview of the size, shape and growth factors of the information technology (IT) industry.
The study consists of three sections, which can be viewed independently or together as chapters of a comprehensive report.
Section 1: IT Industry and IT Workforce Overview
Section 2: IT Industry Growth Projections
Section 3: Technology and Channel Trends
This quantitative study consisted of an online survey fielded to IT industry executives and professionals during late December 2014. It was conducted as part of CompTIA’s quarterly IT Industry Business Confidence Index. A total of 649 IT industry companies participated in the survey, yielding an overall margin of sampling error at 95% confidence of +/-‐ 3.9 percentage points. Sampling error is larger for subgroups of the data. Data was collected in the following countries: United States, n=457; Canada, n=100; and, the United Kingdom, n=92.
As with any survey, sampling error is only one source of possible error. While non-‐sampling error cannot be accurately calculated, precautionary steps were taken in all phases of the survey design, collection and processing of the data to minimize its influence.
Additional data sources cited throughout the report include: IDC, EMSI, Burning Glass Technologies Labor Insights, U.S. Bureau of Labor Statistics, U.S. Bureau of Economic Analysis and others.
CompTIA is responsible for all content and analysis. Any questions regarding the study should be directed to CompTIA Research and Market Intelligence staff at [email protected].
CompTIA is a member of the Market Research Association (MRA) and adheres to the MRA’s Code of Market Research Ethics and Standards.
Read more about Industry Trends.

 Download Full PDF