Introduction
CompTIA designed Cyberstates to serve as a reference tool, making national, state, and metro area-level data accessible to a wide range of users. Cyberstates quantifies the size and scope of the tech industry and the tech workforce across multiple vectors. To provide additional context, Cyberstates includes time-series trending, average wages, business establishments, job postings, gender ratios, innovation and emerging tech metrics, and more. For the interactive online version of Cyberstates, visit www.cyberstates.org.
As with any sector-level report, there are varying interpretations of what constitutes the tech sector and the tech workforce. Some of this variance may be attributed to the objectives of the author. Is the goal to depict the broadest possible representation of STEM and digital economy fields, or a more narrowly defined technology subset? Is the goal to capture all possible knowledge workers, or a more narrowly defined technology subset? For the purposes of this report, CompTIA focuses on the more narrowly defined technology subset. See the methodology section for details of the specific NAICS codes and SOC codes CompTIA uses in its definitions of the tech sector and the tech workforce.
Due to periodic updates to industry and occupation categories by the U.S. Bureau of Labor Statistics, as well as occasional revisions of historical data, direct comparisons to previous publications of Cyberstates is not always possible. Additionally, CompTIA adjusts its methodology at times to best reflect available data and the needs of users. For these reasons, it is best to view the most recent release as the best representation of the state of the tech industry and workforce. If historical comparison data is required, requests can be submitted to [email protected].
Key Points
- The global pandemic devastated many sectors of the U.S. economy and labor market. During April 2020 alone, more than 20 million Americans lost their jobs leading to an unemployment rate approaching levels not seen since the Great Depression.
- The tech sector and the broader base of technology workers employed across the economy experienced several bumps during this turbulent period, but generally held up well. In some cases, demand for technology services and infrastructure to support new remote work models, ecommerce, or revamped supply chains exploded, stretching the capacity of solution providers and MSPs.
- These positives, however, were offset by reductions or postponements in spending and hiring of tech workers, especially in the hardest hit industry sectors of transportation, hospitality, entertainment and related.
- Additionally, several prominent tech and telecom companies had retail divisions where staffing cutbacks occurred in sales, marketing, or customer service, while core technology positions were preserved. Lastly, the IT services segment of the industry is dominated by small businesses serving primarily other small businesses, tends to be more vulnerable to economic shocks.
National Snapshot
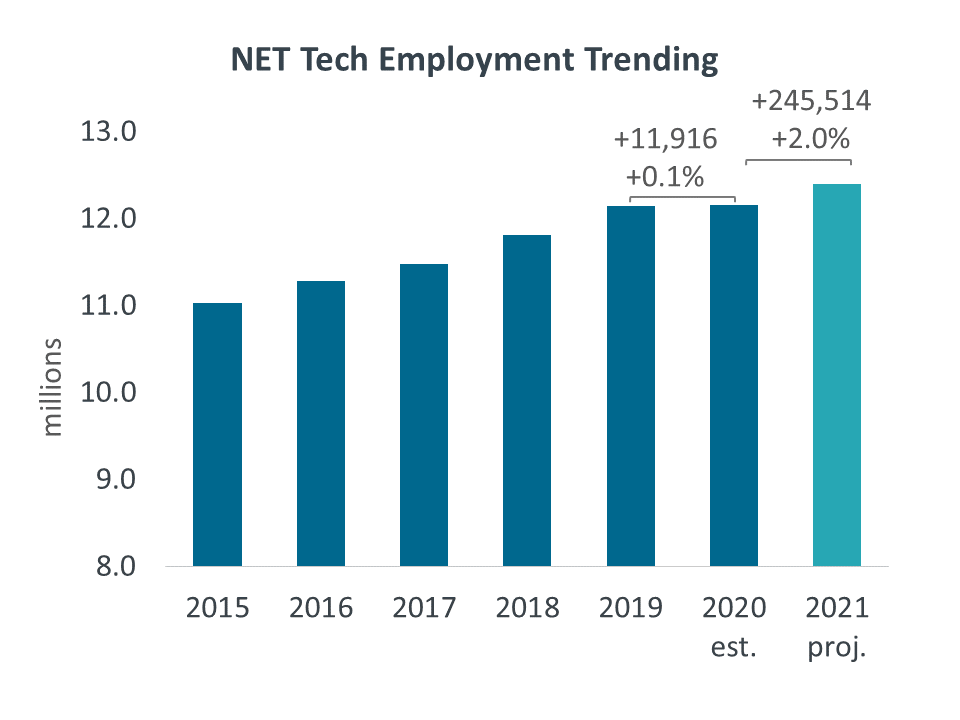
- U.S. net tech employment totaled an estimated 12.2 million in 2020, essentially flat when compared to the previous year. Net tech employment is projected to grow at an estimated 2.0 percent year-over-year reaching 12.4 million in 2021.
- Net tech employment accounted for approximately 7.9 percent of the overall U.S. workforce in 2020. As noted previously, because of the blurring of lines across industries, there is a degree of undercounting in tech sector employment.

- U.S. tech industry employment totaled an estimated 7.7 million in 2020, an increase of 79,540 workers from 7.6 million in 2019. Tech industry employment is projected to grow at an estimated 2.4 percent year-over-year reaching 7.8 million in 2021. As noted,ntech industry employment is a subset of net tech employment.

- The IT services and custom software services subsector will generate the largest numerical gain in employment, adding more than 102,000 net-new jobs in 2021. This gain of 3.8 percent will increase the employment base to 2.8 million. This growth reflects the ongoing digital transformations occurring across the economy and the corresponding need for expertise in areas such as cloud computing migration, application integration, process automation, data analytics, and cybersecurity.
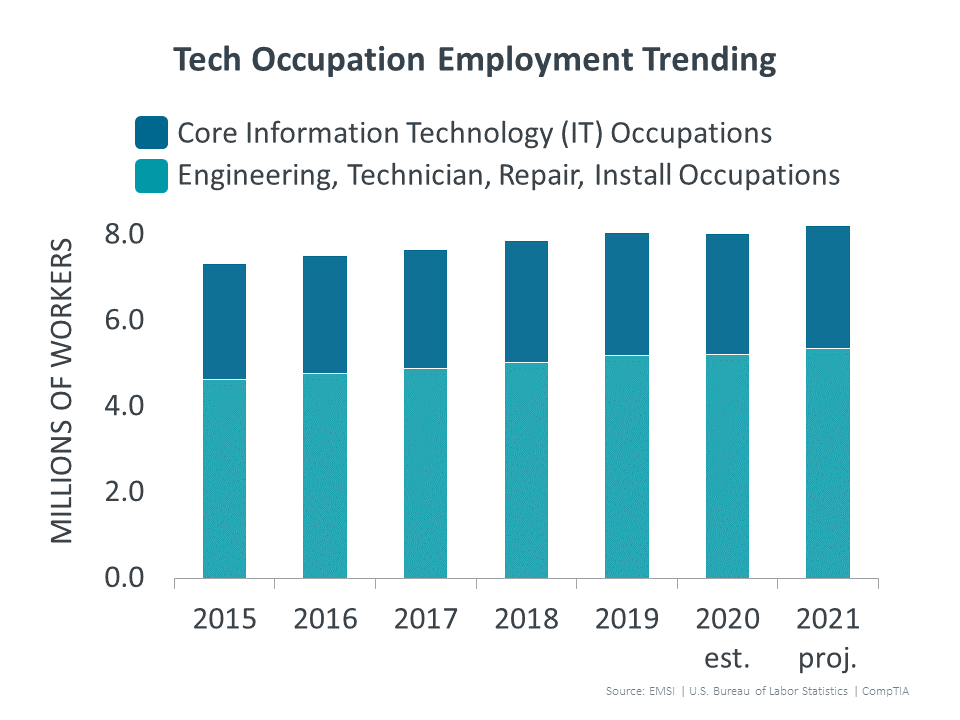
- Tech occupation jobs reached an estimated 8.0 million workers in 2020 and is projected to increase 166,879 jobs in 2021 . On a percent change basis, the rate is on par with the annual growth rates experienced over the past several years.
- Since 2015, nearly 870,000 new tech occupation jobs were added, a function of the demand for tech talent across every industry sector in the economy.
- The IT occupations segment of tech occupations accounts for 65 percent of the total. IT occupations is projected to add over 130,000 net-new jobs in 2021, a year-over-year growth rate of 2.5 percent. On a numeric basis, software developers, systems analysts and cybersecurity analysts, network architects, and IT support specialists recorded the largest gains in employment. The U.S. Bureau of Labor Statistics does not yet break out many emerging tech roles, other data sources indicate these new specialties are starting to make meaningful contributions to the growth of the tech workforce.
- Top projected growth occupations for 2021:
- +4.4% Cybersecurity
- +4.4% Data Scientists
- +3.7% Software Developers and Software QA
- +2.6% Web Developers and Digital Interface Designers
- +2.4% CIOs and IT Managers
- +2.2% Database Administrators and Architects
- +2.2% IT User Support Specialists

State Overview
- Twenty-two states experienced job gains in net tech employment from 2019 to 2020. Forty-nine states are projected to generate positive tech employment job growth in 2021. While the largest job gains are associated with the states with a significant tech presence, the fact that most states experienced tech employment job gains speaks to the broad-based impact of technology across the nation.
- On an industry sector basis, the software services sector has been the growth engine for the greatest number of states over the past year. Year-over-year distribution of counts of top categories by state:
- Software: 43 states
- R&D, Testing, and engineering services: 42 states
- IT services/custom software services: 38 states
- Telecommunications: 24 states
- Tech manufacturing: 17 states
- On a percent change basis, the top five states for job growth in 2020 were Utah (+1.5 percent), Washington (+1.3 percent), New Mexico (+1.3 percent), District of Columbia (+1.2 percent), and Colorado (+1.2 percent).

Metro Area Snapshot
- The top ten metropolitan areas employ a little more than 4 million tech industry and tech occupation workers, or about 1 in 3 tech workers in the nation. New York City is the largest metropolitan area in the country by a wide margin. It follows that it also has the largest base of tech employment.
- Silicon Valley continues to be a critically important hub for innovation. Between San Francisco and San Jose, nearly 12,000 net tech employment jobs were added over the past year. The discussion doesn’t end there, however, as technology increasingly has a significant presence across the nation. Cities such as Boston, Seattle, New York, Dallas, Atlanta, Los Angeles, Denver and more, boast sizable tech workforces and notable job gain rates. This includes the sometimes “under the radar” tech cities of Austin, Raleigh, Charlotte, Phoenix, Detroit, Orlando, and more.
- Employment concentration provides a measure of tech employment relative to employment across all the other industry sectors in a local economy. Along with economic impact as a percentage of a local economy, these metrics help to put tech into context.
- At 34 percent, San Jose has the highest concentration of net tech employment as a percentage of its overall employment base. Similarly, San Jose is an outlier in the economic impact of tech to the local economy at nearly 60 percent, about twice the rate as the next highest metro area.
- Compared to the national tech employment concentration benchmark of 7.9 percent, 28 metro areas had a higher rate, confirming the importance of technology to a far-reaching set of cities across the country.
Read more about IT Workforce & Diversity.
