Section 1:
Market Overview
Key Points
- Data volumes continued to grow unabated, but data is also growing as a priority for businesses. As the cost of computing drops and access to systems becomes simpler, companies are relying on data for day-to-day operations, customer understanding, and business metrics.
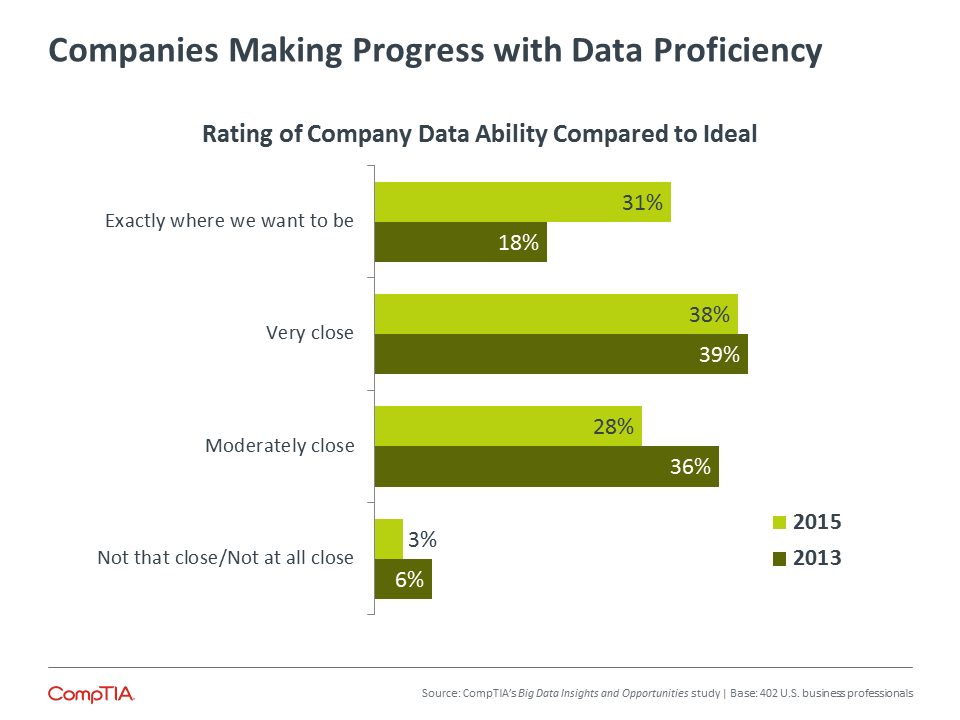
- While 31% of companies being exactly where they want to be with data is a significant jump from 18% in 2013, there are some signals that improvements still need to be made. Only 6% of business unit workers feel this strongly about their business’s data usage, compared to 42% of executives and 31% of IT employees. In addition, 75% of companies still agree with the sentiment that their business would be stronger if they could harness all their data.
- Approximately half of the companies in the survey now claim to have some form of big data initiative in place. While there may be some amount of “big data washing” going on, the net result is that companies are moving forward with data initiatives and seeing results. A net 72% of companies feel that their big data projects have exceeded expectations.
Data: The Lifeblood of Digital Organizations
Over the past several years, it has become easy to grow numb to statistics showing the amount of digital data being generated. Hockey stick-shaped graphs show exponential growth in data, and it is hard to grasp that the small blips on the left still represent massive amounts of data from a historical perspective. Even so, the explosion of data should not be ignored. The trend of big data suffers from some amount of hype and confusion, but it points to opportunities for businesses across a wide range of data usage scenarios.
To be sure, the amount of data crossing the wires and airwaves is mind-boggling. Cisco predicts that in 2016, annual global IP traffic will pass the zettabyte threshold for the first time (for reference, 1 zettabyte = 1 billion terabytes). This milestone will quickly become old news, though—global IP traffic will reach 2 zettabytes by 2019.
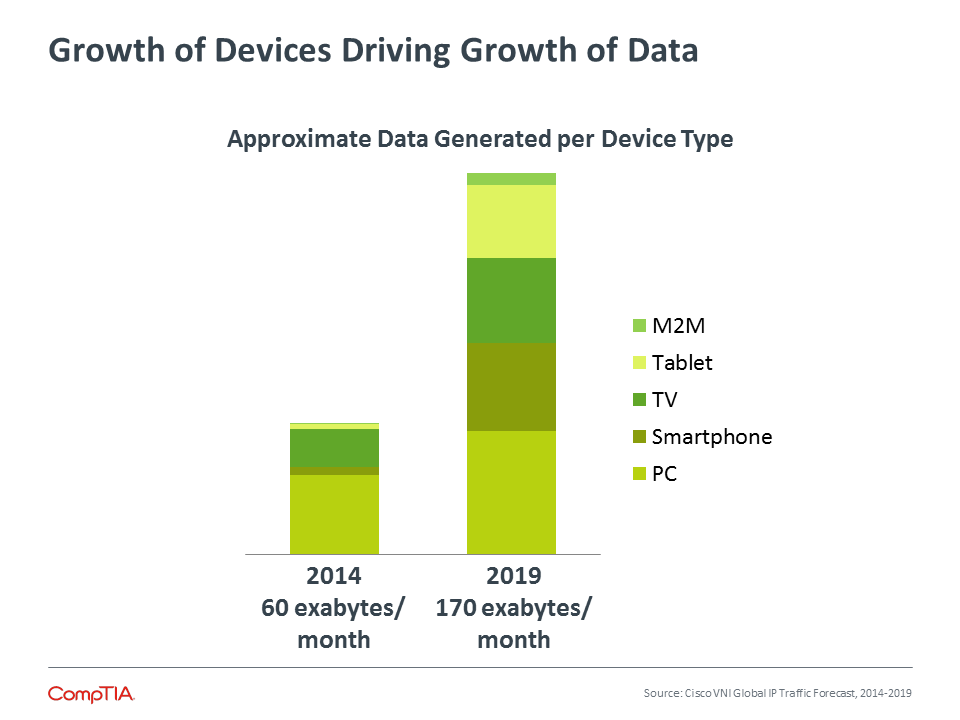
The amount of data, though, is only the beginning of the story. Understanding the drivers behind data growth and the potential ramifications is more important. As Cisco shows, data growth does not come from increased utilization of existing methods, but from new avenues as the number of connected devices expands. Consumer devices in particular are playing a primary role in data growth. While M2M data grows five-fold between 2014 and 2019, it is still a small piece of the overall pie.
Along with growth in raw size, data is growing as a precious commodity. Today, it is not uncommon to see data described as the currency of the digital economy or the lifeblood of a digital organization, suggesting a level of importance and value significantly higher than in previous times. Getting to this point did not happen overnight, but rather through a series of developments on many fronts.
To start, the cost of computing continues to drop. What was unattainable for a given business 10 years ago (or less) is now affordable. Take storage as an example—in 1995, 1 GB of storage cost approximately $1000. Today, that same gigabyte will cost just a few cents. Computing has also become simpler, in large part due to cloud and consumerization. Strong technical understanding may still be needed to make systems fully functional, but access to those systems is broader, allowing a wider range of use.
Taken together, these factors and others have ushered in the era of data. For a variety of reasons, companies are now placing a higher priority on digital data than ever before, and this level of prominence is expected to rise in the future. The data is remarkably consistent across company size—if SMBs in the past were less apt to view data as a critical resource, they are certainly on the same page as their enterprise counterparts today.
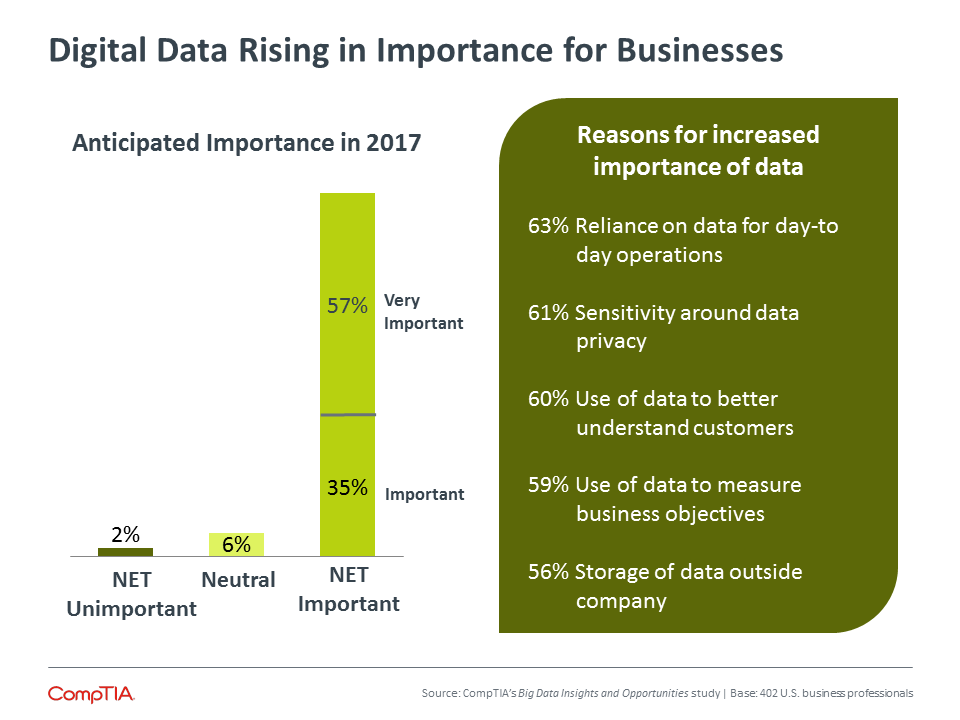
There are some differences with respect to job role, though. The most prominent reason given for data’s newfound significance is the reliance on data for day-to-day operations. Eighty-three percent of business line employees rate this as a top reason, compared to about 6 out of 10 executives and IT employees. This reflects a theme consistent throughout CompTIA research: technology is becoming a more powerful tool for every facet of a company, and business lines are weighing in on technology matters as they use this tool to drive objectives.
With the new role that data is playing, businesses of all types will seek ways to unlock additional value from the data most relevant to them, be it on a large scale or a small scale. Even as the definition of big data expands to include other criteria, the main issues facing many companies still boil down to the original 3 V’s: volume, variety, and velocity. The exact threshold for each of these items is constantly evolving, but the trend is still in its early stages and may eventually come to symbolize Amara's Law: the tendency to overestimate the effect of a technology in the short run and underestimate the effect in the long run.
Assessing the State of Data
While most businesses recognize the growing importance of real-time access to actionable data, few have actually reached their data-related goals. Even fewer can claim to be anywhere near the point of engaging in a big data initiative.
Sizing the Market
As with any emerging technology category, market sizing estimates for big data vary. Different definitions, different methodologies and different time horizons can affect the output and interpretation. With that caveat, the following estimates help provide context in understanding data-related growth trends.
Research consultancy IDC believes that the big data technology and services market will grow at a 26.4% compound annual growth rate to $41.5 billion worldwide in 2018, or about six times the growth rate of the overall information technology market. IDC’s definition of this market includes servers, storage, networking, software, and services.
Separately, IDC estimates spending on business analytics to reach $89.6 billion in 2018. This market includes big data analytics but also more traditional analytics involving relational databases or SQL.
MarketsandMarkets takes the most comprehensive view, defining Enterprise Data Management to include software and services for migrating, warehousing, and integrating all forms of data. The only piece left out is the physical infrastructure. Their forecast for this market is $105 billion in 2020.
According to CompTIA research, 31% of businesses report being exactly where they want to be in managing and using data. This represents a significant jump from 18% in 2013, especially considering the number of firms “very close” to where they want to be remained constant. (See chart in Appendix for details). At first glance, it appears that companies are moving in the right direction. A deeper look at the data, though, suggests that these gains may be overstated.
Once again, job role plays a factor in the analysis. Forty-two percent of executives and 31% of IT employees feel that their company is exactly where they want to be in managing and using data; only 6% of business line employees feel the same way. Obviously, the business line need for actionable data insights is not being met, even if there are some improvements in other areas of data management.
Furthermore, there continues to be strong agreement with the sentiment that a business would be stronger if they could harness all of their data. Previous big data studies have seen approximately 75% of companies agree with this statement, and that trend continues with this year’s study. In addition, 75% of companies feel that they should be more aware of data privacy and 73% of companies feel that they need better real-time analysis. The individual pieces of a holistic data solution may be improving, but those pieces are not yet integrated to drive the ideal results.
While some businesses may have made progress in select areas of data management, many have not fully connected the dots between developing and implementing a data strategy in order to have a positive effect on other business objectives, such as improving staff productivity, or developing more effective ways to engage with customers. For IT solution providers or vendors working in the big data space, this should serve as an important reminder to connect data-related solutions to business objectives, emphasizing outputs over the nuts and bolts of the inputs.
Where to begin? Examining specific data practices is a more accurate gauge of progress with data initiatives, and it shows those disciplines that businesses are most anxious to improve. Overall, there is improvement across the board in the past two years. Some areas have made big leaps, such as real-time analysis of incoming data (26% doing well in 2013). Other areas have seen more modest gains, such as relationship analysis (26% doing well in 2013).
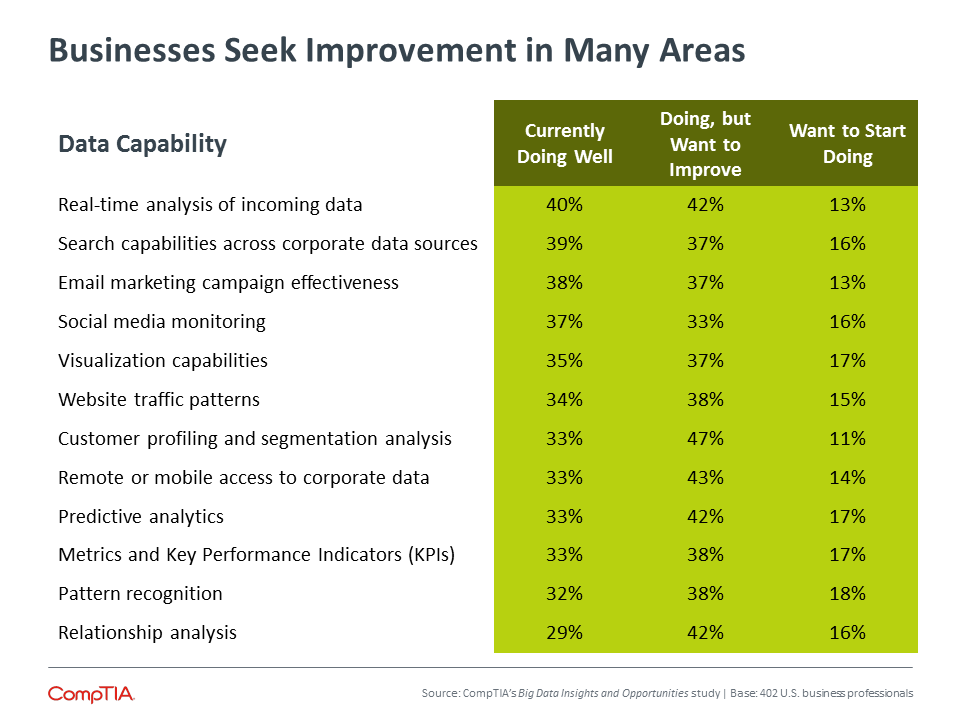
The incremental improvement across individual data capabilities is likely a more accurate picture of where organizations stand with data management and analysis, rather than the giant leap in perceived status when it comes to data. Although there has been some good progress, there is still a long way to go.
Making the Most of Data
For those companies that are not exactly where they want to be with data usage, the first question to answer is which behaviors they hope to improve through enhanced data management and analysis. It is no surprise to see a desire for better decision making at the top of the list. The big data trend saw a rapid ramp in hype due to two factors. First, it followed the momentum of cloud computing, where companies without much infrastructure started with a cautious approach but quickly jumped on board as they realized that cloud could more easily help them expand. Second, the discussion around big data always centered around decision making, a topic with more universal appeal than infrastructure.
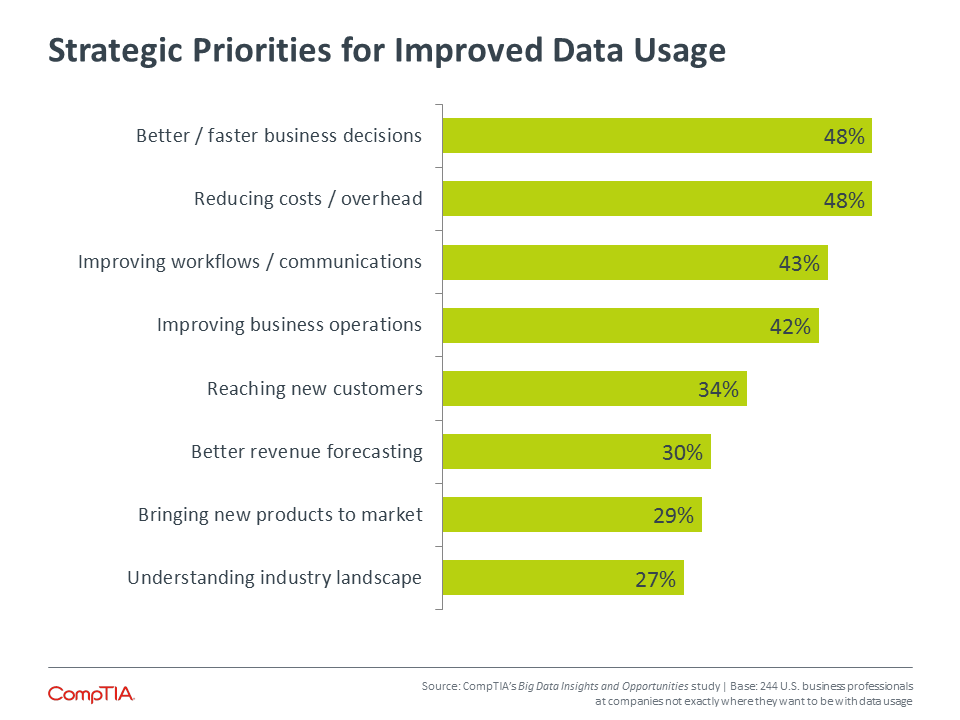
The second highest strategic priority is reducing costs. As with other trends, this reflects an oversimplified view of technology’s potential. For a topic like big data or data management in general, the ultimate goal is business transformation, whether that transformation takes the form of improved customer relations, new business offerings, or innovative thinking. All of these transformative changes imply value beyond simple cost savings, and data initiatives should be evaluated with that full value in mind.
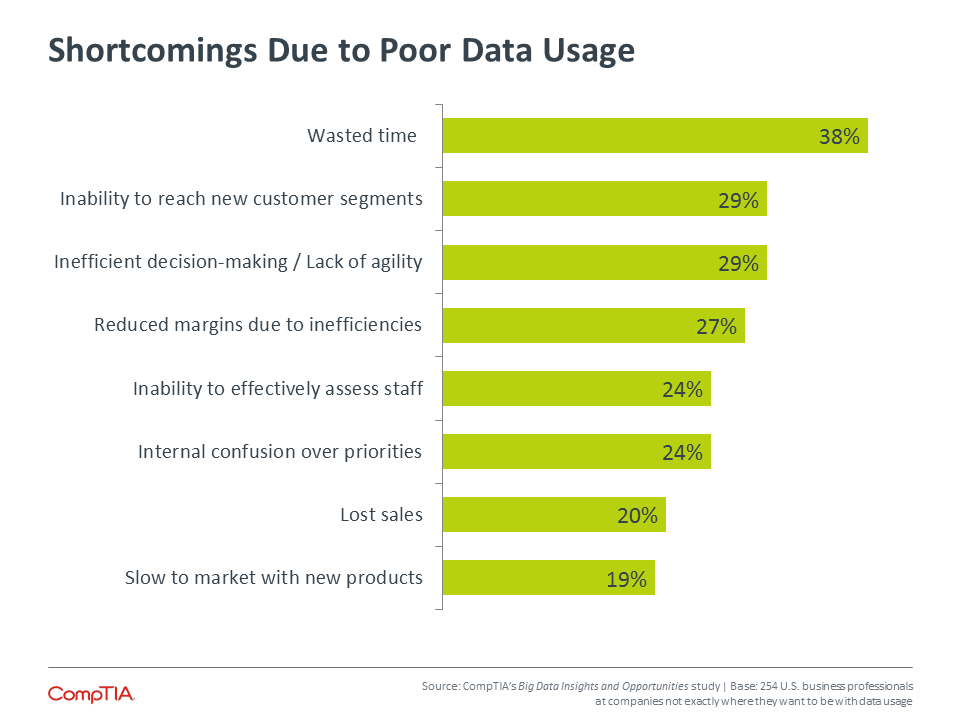
Viewed through a different lens, businesses experience various shortcomings as a result of poor data management or insufficient data analysis. Chief among these is wasted time. As different pieces of an organization have to hunt for the data they need, it consumes time that they could be using to focus on their function and on new innovations. Increased efficiency, another common goal for technology, comes as a result of well-designed systems and workflow. Data management should be treated as a comprehensive program, not point tools for specific purposes.
It is interesting to note how companies with different levels of data capabilities view their shortcomings. Only 8% of companies who classify themselves as having a basic level of data capability view being slow to market with new products as a shortcoming, compared to 22% of companies who feel they have intermediate data capabilities and 21% of companies who feel they are advanced. In the same vein, 44% of companies in the advanced bucket view confusion over priorities as a shortcoming, compared to just 21% of companies in both the basic and intermediate buckets.
This shows that data savvy is not just a statement about technical aptitude, but also a statement of understanding of how data can play a role in multiple aspects of organizational life. Early stages of technology adoption feature a high need for education. Companies that are coming up the learning curve need examples of how data can be transformative, especially at an SMB level where stories from Facebook and Google do not apply.
Adoption of Big Data
The trends all point to businesses being on the edge of mass adoption of big data technologies. In addition to the desire to improve data capabilities, companies are feeling more comfortable with the topic. Seventy-three percent of companies say they feel more positive about big data than they did a year ago, with 23% of those firms feeling significantly more positive.
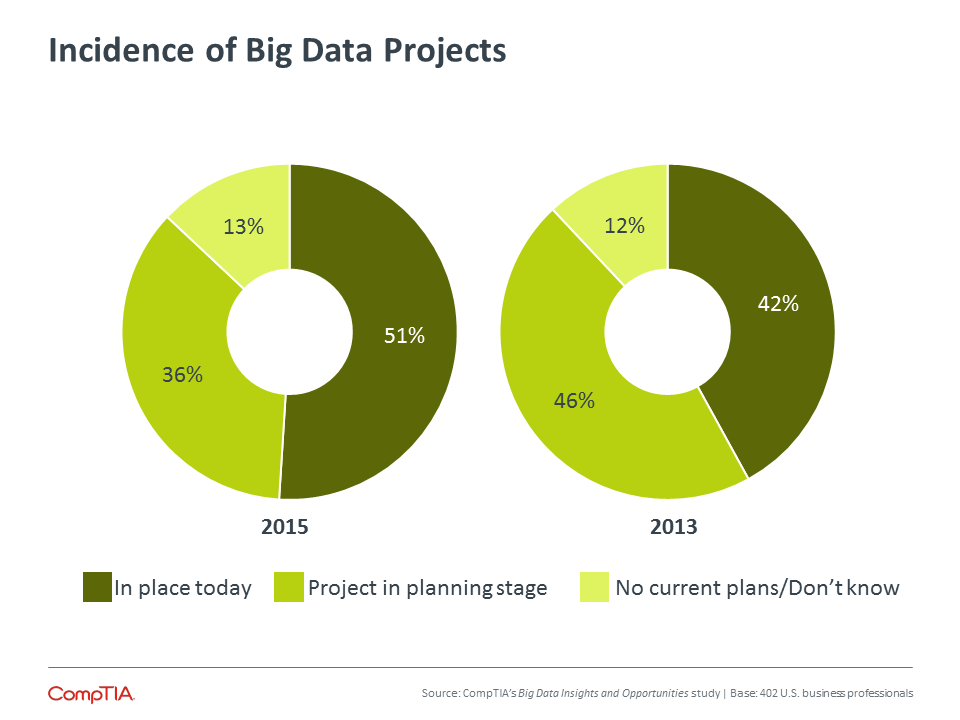
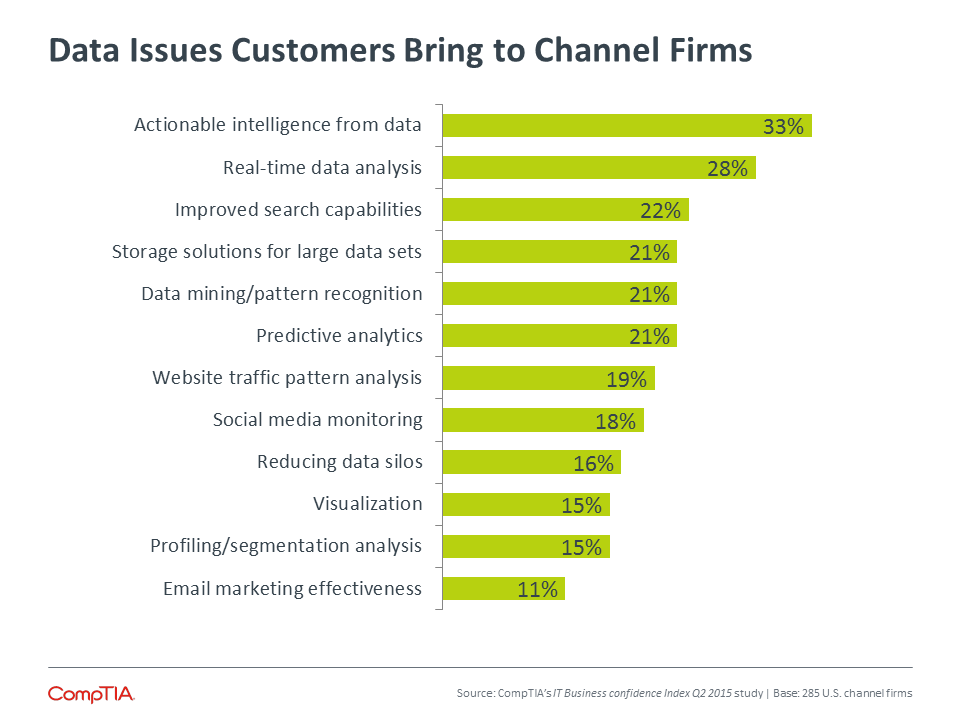
Adoption over the past two years appears to have taken a reasonable path, and approximately half of the companies in the survey now claim to have some form of big data initiative in place. This follows a predictable pattern based on company size: 62% of large firms (500+ employees) claim big data adoption, compared to 55% of medium-sized firms (100-499 employees) and 38% of small firms (less than 100 employees). Channel firms also report accelerating customer interest around big data—46% of channel companies in CompTIA’s IT Industry Business Confidence Index Q2 2015 reported a moderate or significant increase in customer inquiries.
For big data, there are several parallels to the adoption patterns from cloud computing. To start, company claims may not match a strict technical definition. For example, 63% of companies claim to currently be performing analytics on distributed storage systems. However, TechNavio predicts that distributed storage revenue in 2019 will be $2.4 billion, and Wikibon projects the overall enterprise storage space to generate $43.1 billion that same year. The percentages don’t add up, and it is likely that many companies using networked storage or cloud storage believe that is automatically the same as a distributed data warehouse.
As with cloud computing, these fine distinctions are probably unimportant in the grand scheme. The bottom line is that companies are seeking improvements to their data strategy. Whether that means the use of distributed storage and Hadoop or the use of relational databases and basic analytics tools will depend on the company, but there is great opportunity to have discussions about data and begin taking steps forward. The terminology is only important when it comes to describing and correctly selecting different options.
The final parallel with cloud computing is the potential benefit in undertaking a data initiative. Among the companies that claim to have big data projects underway, 38% feel that the project has greatly exceeded expectations and 34% feel that the project has somewhat exceeded expectations. When done correctly, data management and analytics can deliver many returns, including efficiency, innovation, and growth. Data is truly the new business currency, and digital organizations with the right strategies are beginning to cash in.
Appendix:
Section 2:
Usage Patterns
Key Points
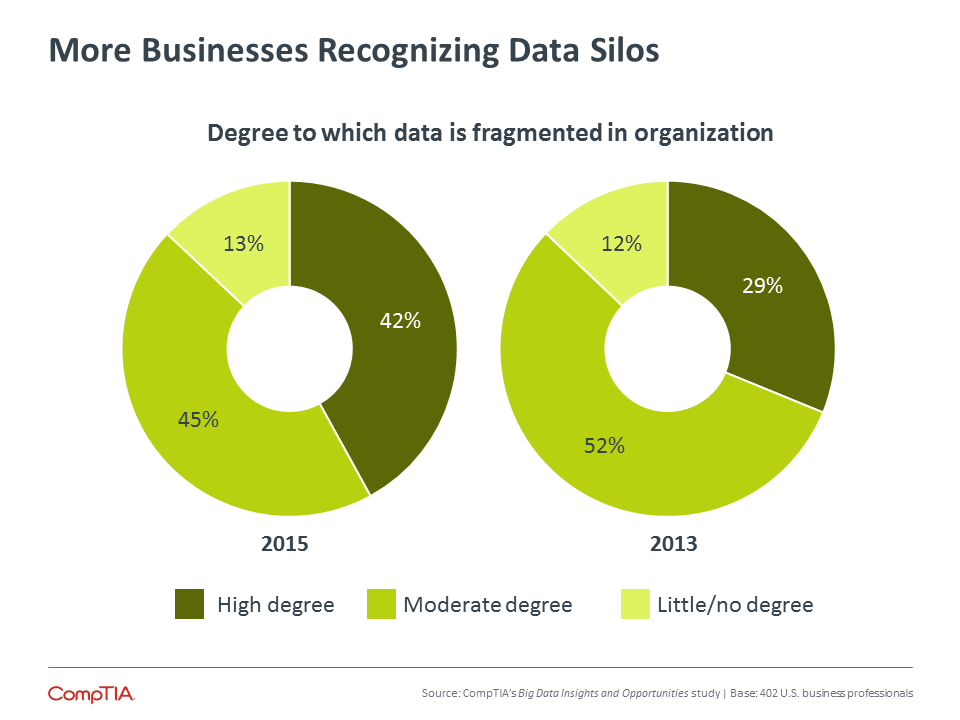
- Businesses see growing data volumes from a number of different applications, but they also see growing data silos. Forty-two percent of companies report a high degree of data silos in the organization, up from 29% in 2013.
- Data management tools and techniques are fairly basic for most companies, with Microsoft Excel and Google Docs acting as primary tools being used for data activities. To get from basic to advanced, companies have to take measured steps across three areas of data usage: collect/store, process/organize, and analyze/visualize.
- Business continuity and disaster recovery is an ideal process for businesses to consider as they move forward with data. Only 51% of companies’ report having a comprehensive BC/DR plan. With a greater reliance on data for operations and a greater customer expectation for data to be readily available, organizations should explore the options available for BC/DR including cloud systems and third party management.
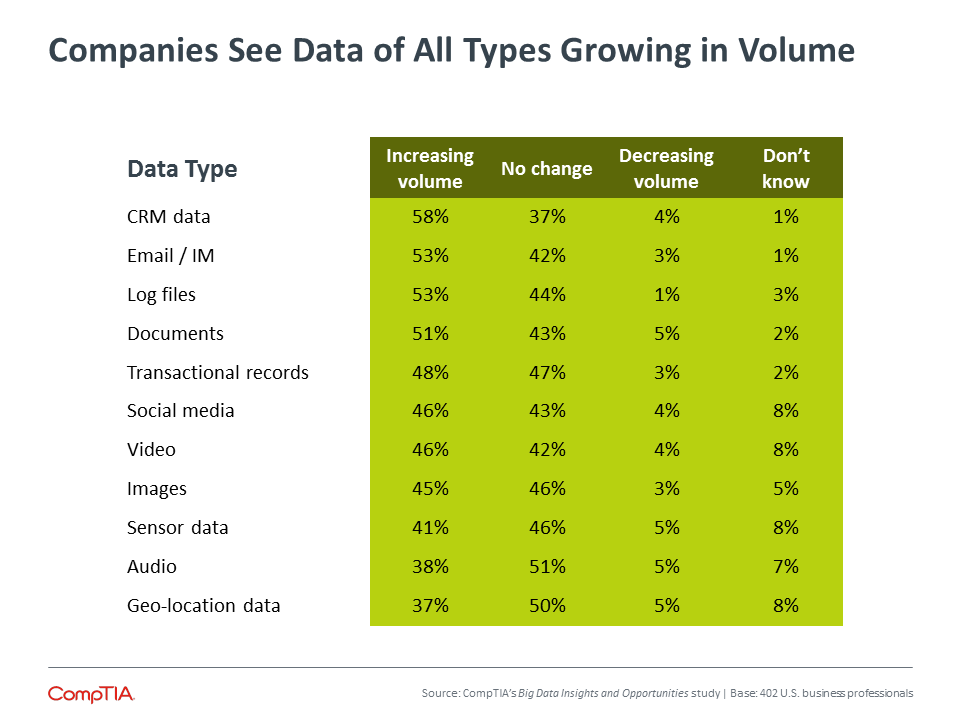
The Details Behind Corporate Data
The big data trend has appeal for businesses because it promises improved decision making, but also because it rings true when they consider their operations. As they evaluate the data flowing through the organization, they see growing volumes across a wide variety of data sources—easily hitting two of the three V’s in big data’s definition.
From here, companies begin to assume that they can use new technology to uncover the insights buried in their data stores. Unfortunately, they quickly run into problems. For one, the data is often siloed, with different departments throughout an organization maintaining their own information. The number of companies reporting data silos has risen dramatically in the past two years, indicating that companies are starting to examine their data situation more closely as they begin to pursue more advanced analysis.
Medium-sized businesses are particularly susceptible to fragmented data. Over half (52%) of medium-sized businesses report a high degree of data silos, compared to 37% of small companies and 39% of large companies. Small businesses are dealing with less data and are probably less aware of any rogue repositories. Large enterprises have stricter management in place along with the resources to handle proper data warehousing. Medium-sized firms, with departmental sprawl but low capacity for oversight, are caught in the middle.
Data silos are a by-product of insufficient data management, and they also cause some operational headaches. Consider this example: In GE’s water division alone, there were 22 separate enterprise resource planning systems. By consolidating these into a single system, the division was able to reduce the number of days needed to close the books at the end of the quarter from four to one. With information scattered in different areas, it is a challenge for employees to access all the pieces they need. Similarly, advanced analytics tools work best on a full set of data when searching for deep connections and insights. To fully understand the extent of silos and the ways to begin consolidating data, companies should perform data audits and carefully plan a path forward.
That path forward leads to a new set of tools. Today, as in the past, the predominant tool companies claim to be using for data analysis is Microsoft Excel. Other entries in the top five include Microsoft Sharepoint (primarily a collaboration platform) and Google Docs (Google’s online version of the Office suite that contains Excel). While these tools have analysis capabilities, they are not the most powerful tools on the market.
The remaining tools in the top five are Microsoft SQL Server and Oracle. These tools have considerably more functional depth, but many companies may not have the skills required to properly tap into this depth. These are common applications for hosting databases, so the amount of actual analysis being done is somewhat up for debate.
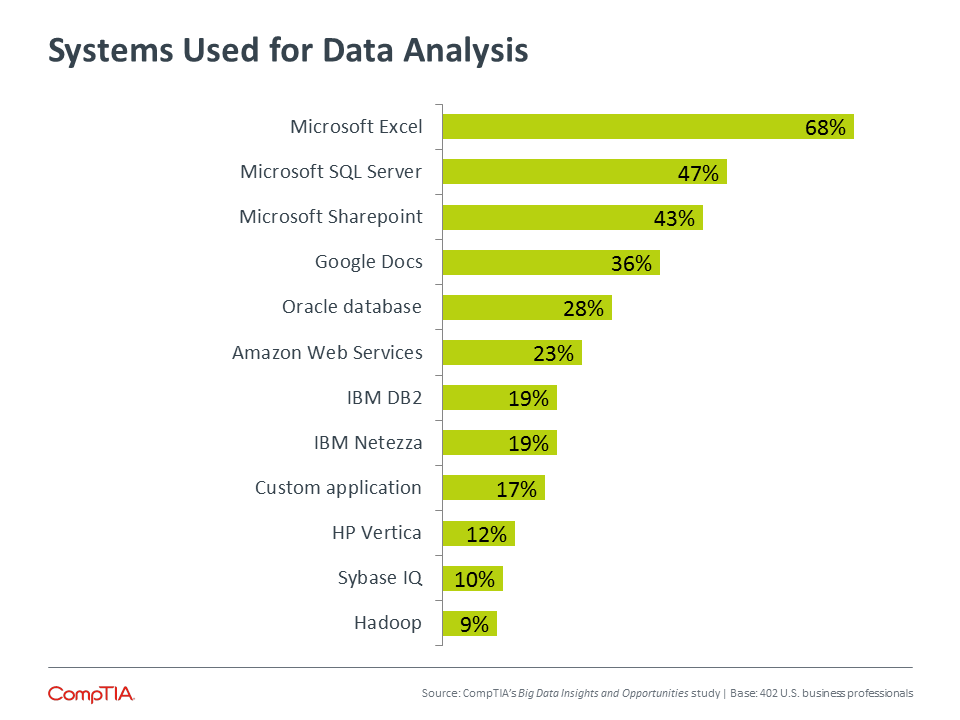
Clearly, the adoption of tools specifically designed for heavy data analysis is low. Adoption of these tools among large companies is higher, but not always by a wide margin. For example, adoption of SAP’s Sybase IQ application is fairly constant (11% of large companies, 9% of medium-sized companies, 11% of small companies), whereas adoption of Hadoop is more divergent (14% of large companies, 8% of medium-sized companies, 6% of small companies). More dramatic differences are seen when looking at companies according to their self-assessed data analysis capabilities. For Sybase IQ, 16% of companies classifying themselves as advanced use the tool, compared to 9% who classify themselves as intermediate or basic.
The way companies classify themselves on an analysis spectrum sheds light on how important analysis is for overall data initiatives. Sixty-three percent of companies say that they are currently performing some form of data analysis, whether that be understanding sales trends, visualizing website traffic, or analyzing customers. However, just 26% view themselves as operating at an advanced level, with 50% classifying themselves as intermediate and 24% seeing themselves at a basic level. The number of companies at an advanced level tracks closely with the 31% of companies who feel they are exactly where they want to be in overall data aptitude.
Moving Forward
To get from basic to advanced, companies have to take measured steps. For those companies that have not thought much about data management, it will be helpful to consider the three stages of data usage. In each of these stages, businesses can ask pertinent questions: Where does our data come from? How quickly do we want to process different data streams? What answers need to be provided as the data is analyzed?
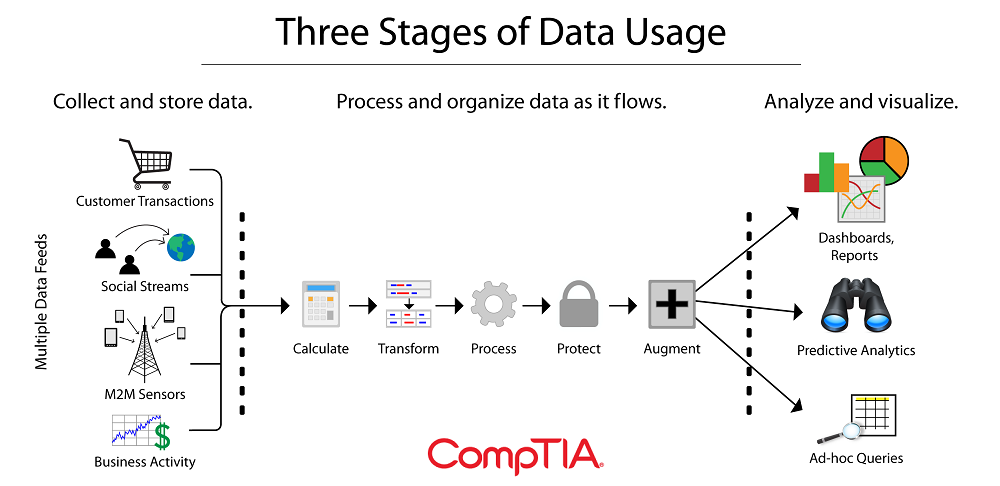
As these questions are answered, companies can turn their attention to the different technologies available to build the required solution. Since the early days of databases, sequential query language (SQL) has been vital to the storing and managing of data. SQL has a long history and is well-known among developers for its ability to operate on centrally managed database schemas and indexed data, but it also has its limits. As data volumes grow, the architecture of SQL applications that operate on monolithic relational databases becomes untenable. Furthermore, the types of data being collected no longer fit into standard relational schemas. Two classes of data management solutions have cropped up to address these issues: NewSQL and NoSQL.
NewSQL allows developers to utilize the expertise they have built in SQL interfaces, but directly addresses scalability and performance concerns. SQL systems can be made faster by vertical scaling (adding computing resources to a single machine), but NewSQL systems are built to improve performance of the database itself or to take advantage of horizontal scaling (adding new machines to form a pool of resources and allow for distributed content). Along with maintaining a connection to the SQL language, NewSQL solutions allow companies to process transactions that are ACID-compliant.
To handle unstructured data, many firms are turning to NoSQL solutions, which diverge further from traditional SQL offerings. Like NewSQL, NoSQL applications come in many flavors: document-oriented databases, key value stores, graph databases, and tabular stores. The foundation for many NoSQL applications is Hadoop. Hadoop is an open source framework that acts as a sort of platform for big data—a lower-level component that bridges hardware resources and end user applications.
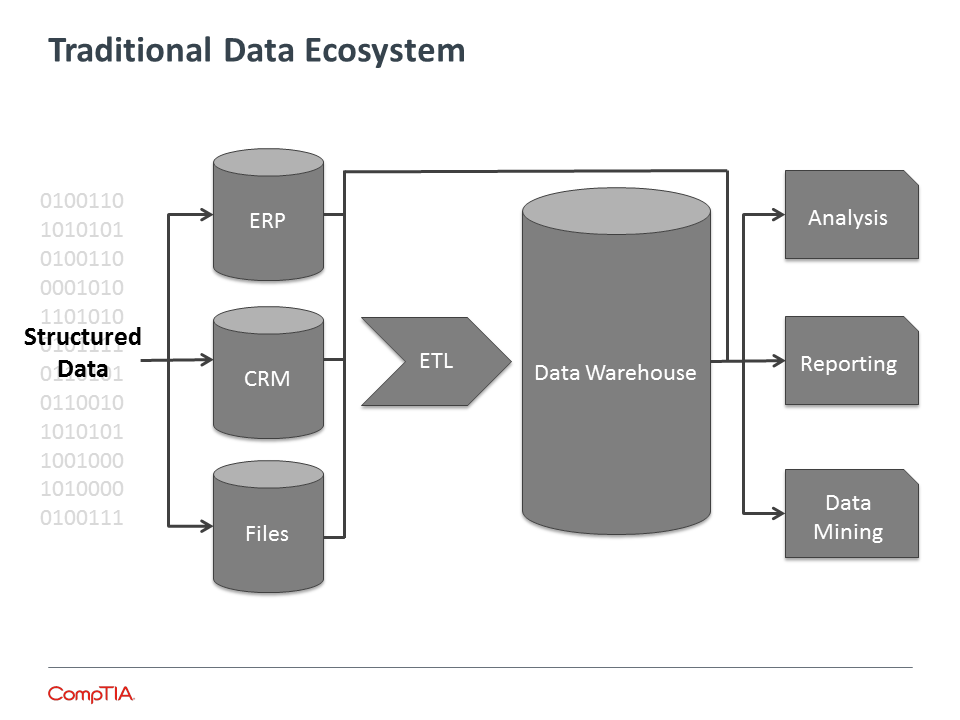
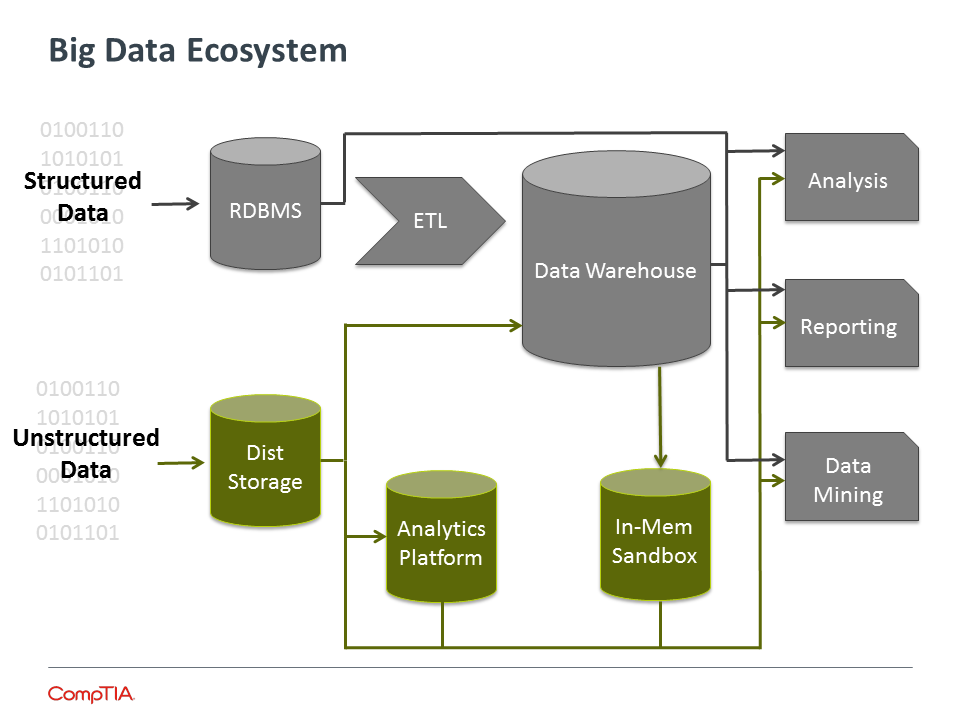
NoSQL solutions are flooding the marketplace as customizations are built on a Hadoop framework for usability or targeting of specific issues. Examples include Pig (a high-level interface language that is more accessible to programmers), Hive (a data warehouse tool providing summarization and ad hoc querying via a language similar to SQL), and Cassandra (a database that provides more capability for real-time analysis).
High-level views of data ecosystems show the ways that big data elements complement traditional elements and also add complexity. While some of the transitions look similar, such as a move from individual data silos into a data warehouse, the transactions are different—migrating unstructured data is a different operation from the standard Extract, Transform, Load (ETL) processes that are well established. In addition, there are new possibilities available to those analyzing data, such as in-memory databases using SSD technology.
Given the distributed nature of big data systems, cloud solutions are appealing options for companies with big data needs, especially those companies who perceive a new opportunity in the space but do not own a large amount of infrastructure. However, cloud solutions also introduce a number of new variables, many of which are out of the customer’s control. Users must ensure that the extended network can deliver timely results, and companies with many locations will want to consider duplicating data so that it resides close to the points where it is needed. The use of cloud computing itself can create tremendous amounts of log data, and products such as Storm from the machine data analyst firm Splunk seek to address this joining of fields.
Companies on the leading edge of the big data movement, then, are finding that there is no one-size-fits-all solution for storage and analytics. Standard SQL remains sufficient for certain operations, and both NewSQL and NoSQL solutions have specialized benefits that make them worthwhile. As products continue to evolve (such as NewSQL systems handling unstructured data or NoSQL systems supporting ACID), the classifications may fade in importance as specific solutions match up with specific problems. With data streams constantly flowing from various sources, there are opportunities to improve services or trim costs by rapidly digesting and analyzing the incoming data. To capitalize on these opportunities, there will be a growing need for education, product selection, and services surrounding big data initiatives.
Focusing on BC/DR
Overall data initiatives will consist of several discrete endeavors. Business continuity and disaster recovery is one process that provides good insight into the current state of data for many companies. It is also a process that can act as a good starting point for moving forward, with cloud options and outsourcing potential creating a range of possible solutions for this critical need.
Just over half (51%) of all companies report having a comprehensive BC/DR plan. The good news is that there has been a nice jump in the past two years—only 41% of companies in 2013 reported having a comprehensive plan. The bad news is that 51% is still awfully low, especially considering the findings from the Ponemon Institute showing that 30% of organizations that experience a severe data interruption never recover.
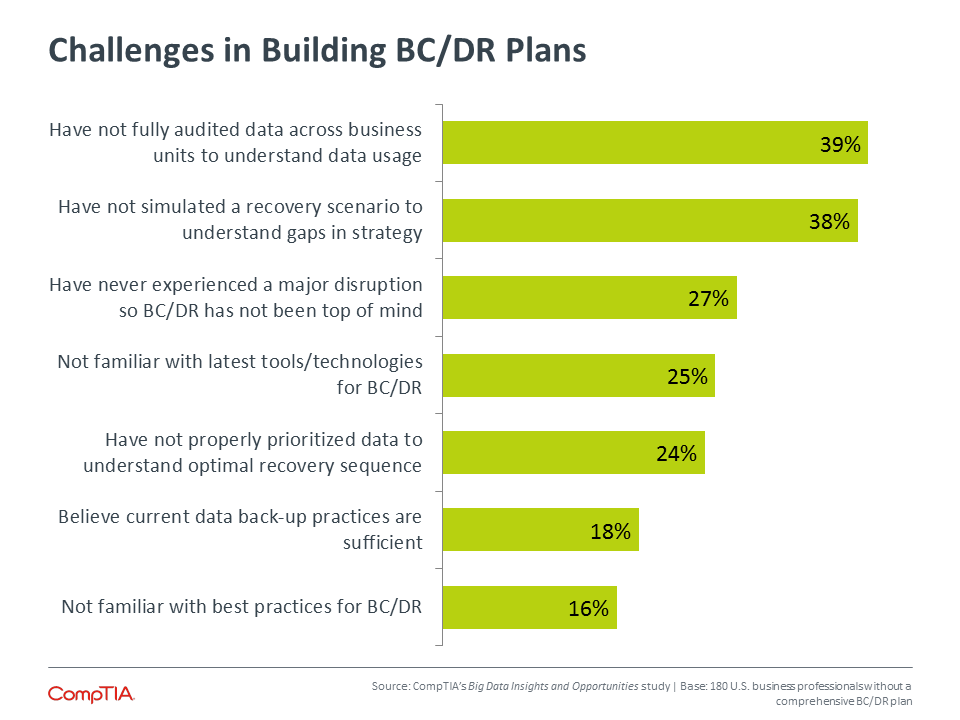
The responses from different segments of the population highlight some of the dynamics in the BC/DR space. As expected, those companies viewing themselves on the advanced end of the data capability spectrum are most likely to have a comprehensive plan. Seventy-eight percent of advanced companies report having a comprehensive plan, compared to 43% of intermediate companies and 39% of basic companies.
The breakdown by company size does not follow the typical pattern though. Things start as expected, with small companies the least likely to have a comprehensive plan (42%). But then medium-sized companies are actually the most likely to report having a comprehensive plan (60%), with large companies falling in the middle (52%). It is likely that the word “comprehensive” creates a sticking point for many large companies. When operations grow sufficiently complex, it may not be feasible for an enterprise to consider a holistic recovery (and truth be told, a complete outage across such operations is fairly unlikely). Instead, recovery plans may be set for individual divisions or business units.
The most interesting breakdown comes when considering job role. Fifty-five percent of employees in an IT function report having a comprehensive plan, compared to just 47% of executives and 37% of employees in a business function. This points to the ongoing need for IT to communicate properly at a level that the business understands. Plans are only practical if everyone involved understands how systems will be restored and operations will continue.
Discussions are also important for internal IT departments or solution providers working towards building better BC/DR plans. These discussions will most often start with the driver, the motivating factor that leads companies to realize that they should invest in a well thought out strategy. Among firms that do not yet have a comprehensive plan in place, the leading factor that could drive BC/DR improvement was the reliance on data within the organization, cited by 44%. Closely following this was customer expectation, cited by 35%. The shifts in technology are creating new demands from customers for the digital experience, and data availability is a key component of that experience.
Section 3:
Workforce Perspectives
Key Points
- The most common driver for data initiatives is the CEO or business owner. With data initiatives reaching across the whole organization, this is the most sensible focal point, especially inside small businesses. Outside small businesses, the CIO or IT function is the primary driver, reflecting that IT often maintains control of technical projects even as business units gain more influence.
- As with most new technology undertakings, having the right skills can be a major hurdle for data projects. Forty-nine percent of companies feel that they currently have the appropriate level of skill, with the remaining companies seeing skills gaps in real-time analytics, relational databases, and data security among other areas.
- In lieu of building the proper skills in-house, companies are turning to third parties for help with data initiatives. Over a third of all companies work with IT firms for their data needs. These needs tend to be somewhat simplistic, covering areas such as data storage or data backup. Channel firms should explore opportunities in creating comprehensive end-to-end services around data.
Who Makes the Call
The use of data to drive business objectives is the type of initiative that goes beyond the installation of new technology. As data is coming from and being used by all areas of the organization, there needs to be a comprehensive view of the overall system. In addition, the focus on business outcomes makes this a prime area where business units will want to weigh in.
Although business units are weighing in, no individual department typically acts as the primary driver for data initiatives. Surprisingly, the marketing team—commonly viewed as a group that is becoming a major player in enterprise technology—does not even rank in the top five groups within an organization that drives data projects. While no single business unit stands out as a driver, data projects clearly have a business connection and an overall organizational impact, since CEOs are the most likely person to be promoting better data management and analytics.
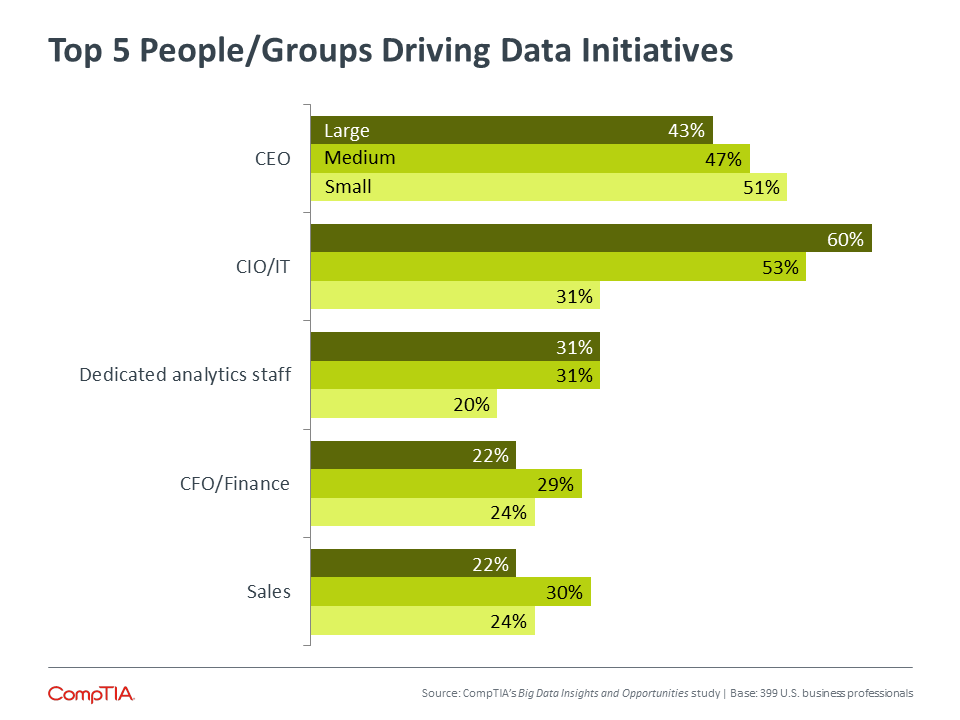
Aside from the CEO, the data confirms a pattern seen in CompTIA’s Building Digital Organizations report: the IT function still acts as the primary driver for many technology projects. In fact, the IT function would likely be the top driver overall if not for the absence of a formal IT team in many small businesses. The formation of technology projects within a company is certainly changing, but IT still takes a lead role in many cases.
The data on procurement and management of data solutions sheds more light on the division of labor. Four out of ten companies say that procurement and management is all handled by the IT team, making this the most popular route. Another 38% say that the IT team handles all procurement, but the business units manage the solutions. In these cases, management likely happens after implementation. Business units are building enough technical skills for day-to-day operation, but not enough for installation and integration.
In the remaining companies, procurement and management is split between the IT team and the business units. Even in these cases, the incidence of rogue IT (where the IT team is completely out of the loop on a technology solution) is low. Just 7% of companies say that the IT team is sometimes unaware of a solution being put in place.
The Search for Data Skills
If the IT team is primarily responsible for new data solutions, are they up to the task? About half of all companies feel they are in pretty good shape. Some of these companies are likely the same ones that feel they are exactly where they want to be with their use of data. For the other companies with the appropriate level of skill, getting to their ideal place is a matter of organizational process that allows the skilled workers to use their talents effectively.
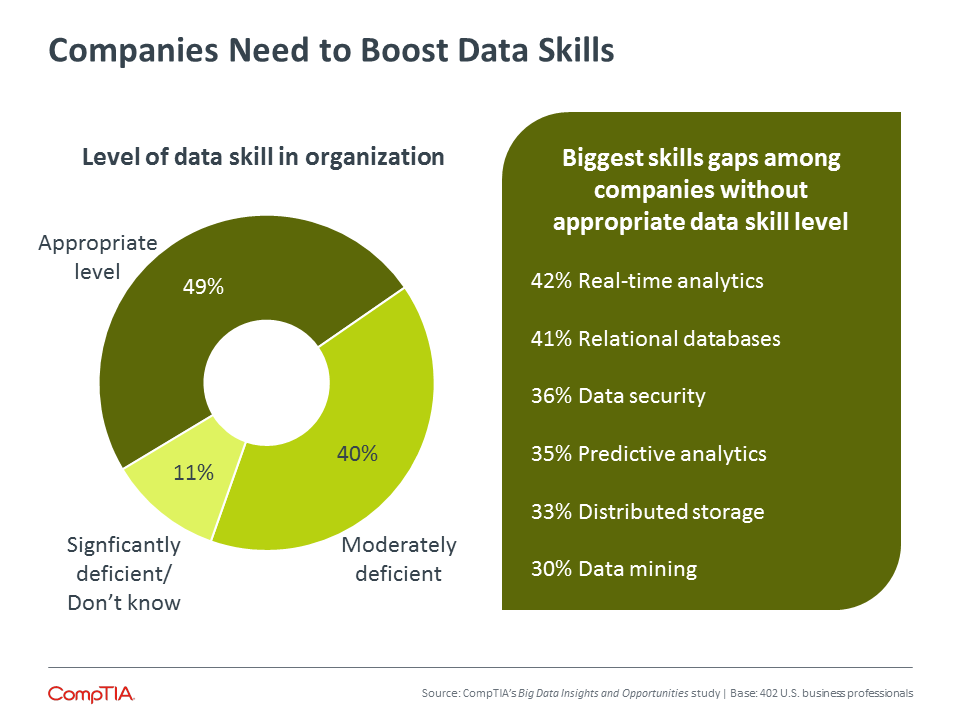
For companies without the appropriate skill level, there are many different areas that could help improve the situation. Real-time analytics is on the top of the wish list, and while there are technologies that directly address this, those technologies remain very advanced for many smaller companies. As they build their data capabilities, these companies can focus on process as a more attainable tool for improving speed.
The second largest skills gap demonstrates the foundation that many companies must build before moving to a more advanced level. Relational databases have formed the basis for data management and analysis for decades, but they still represent a step forward for many companies with no existing data strategy. The skills here are more widely available than the skills in areas such as predictive analytics or distributed storage.
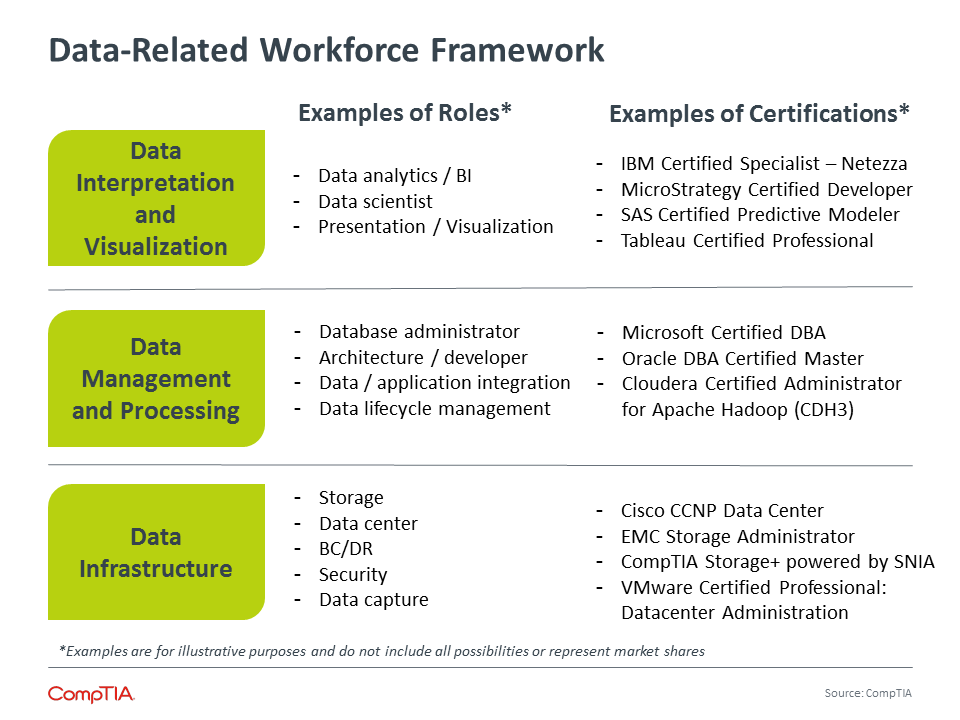
Closing data skills gaps is no easy task. To start, there are a wide range of data-related skills. The common job role cited is “data scientist,” but there are many different roles, and every role contains some blend of IT-centric skills and business-centric skills.
Furthermore, many of these skills are relatively new, especially considering the ways that business would like to see the different skill sets combined. Demand is rising astronomically—in October 2010, the job posting site Burning Glass reported 116,137 job postings related to business intelligence or databases/data warehousing. Five years later, the same skill sets had 208,619 job posts. Such a rapid increase cannot be filled immediately. Candidates are building their expertise, but it will take time to reach equilibrium.
Thanks to the shortage of candidates with the perfect skill set, businesses are primarily turning to in-house training. Sixty-one percent of companies say that they are providing training to existing employees in the areas of data management and analysis. This is especially true among large enterprises and medium-size companies; small firms struggle more to bring the appropriate training or start with the proper foundation. Even so, 53% of small companies are using training as a tool to build skills.
The Use of Third Parties
Another way that companies are boosting their data capability is through the use of third parties. Thanks to the various ways that data can be used, companies work with a variety of different outside firms, including general business consultants, digital strategists, and marketing specialists.
The most common type of outside help is consultants, vendors, or solution providers that specialize in IT. In other words, companies are turning to their trusted network within the IT channel for help with data strategies. Over a third of all companies are working with IT firms for their data needs, including 30% of small businesses, 46% of medium-sized firms, and 33% of large enterprises. Another 35% of end user companies are considering use of a third party.
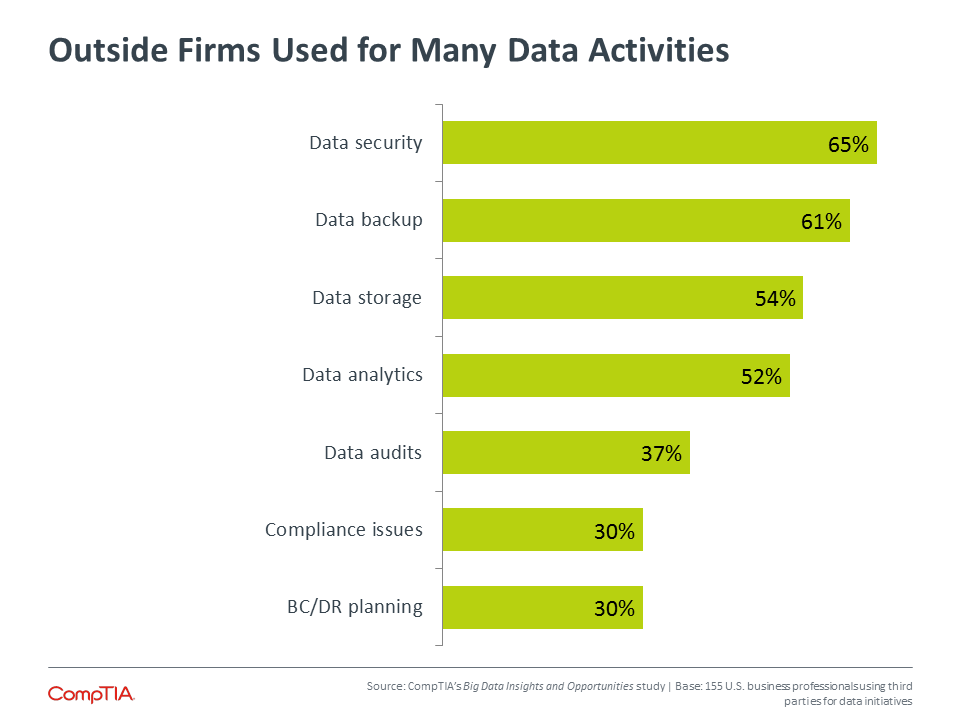
Outside firms are used for a wide range of activities, but those activities point to some of the challenges that exist in the market today. First, there are issues of semantics—65% of companies using third parties say that the outside firm performs data security, but it would be worthwhile seeing how many of these solutions employ a true data tool such as DLP vs. standard security such as firewalls.
Second, the primary data activities are centered around components rather than end-to-end services. Data backup and data storage are necessary concerns for every business, but on their own they do not provide as much value as a holistic dataflow strategy or a BC/DR plan.
That leads to the final complication. Many third parties have not built sufficient skill around these end-to-end services or newer aspects of data management. Twenty-two percent of companies not using outside firms say that they have not been able to find third parties with the right data skills. CompTIA’s 2015 Trends in Managed Services report also found many companies with the same experience.
Channel firms are working to bridge this gap. Companies surveyed in CompTIA’s IT Industry Business Confidence Index Q2 2015 survey cited several challenges in building out data solutions, including figuring out the right business model (33%), finding the right resources (28%), and identifying the right vendors (26%). Twenty-one percent of solution providers have already aligned with new vendors, particularly in the areas of analytics and visualization.
Tapping into the full potential of data is a major challenge for businesses as they enter the cloud/mobile era of enterprise technology. Big data with its hidden insights holds a great deal of promise, but companies must first ensure that they have a solid foundation of data management and analytics. From there, they can extend their skills into the tools and techniques required to drive a new wave of decision making.
A Small Business Data Story
As this report has shown, big data is a tricky thing for most small businesses to jump into. Through a combination of untidy data management and minimal data aptitude, small businesses often view big data as aspirational—it would be nice to get there, but it’s not especially attainable.
However, big data simply sits on the top end of the overall data spectrum. By reducing data silos, implementing improved tools, and building appropriate skills, small businesses can take the first steps towards becoming a digital organization that intelligently uses data for operations and decisions.
Twiddy and Company Realtors in Duck, NC is a prime example of how small businesses can harness the power of data to meet their objectives. This 85-person vacation rental and real estate outfit started in 1978, prior to the Outer Banks becoming a tourist destination. Over time, the region became a hot spot and technology changed dramatically. In the past several years, Twiddy has changed their data management to help them both reach customers more effectively and run the business more efficiently.
In 2002, Twiddy took the same steps that many small businesses have taken when building a web presence: shifting energy to their website and advertising with Google AdWords. However, Twiddy did not view this as a vague sunk cost that could possibly produce results. They also set up a Google Analytics account to track activity. Google Analytics is free and requires minimal training, and Twiddy was able to see results quickly. Between 2006 and 2007, website traffic increased by 26% and online bookings increased by 50%. After becoming familiar with Google Analytics, Twiddy has been prepared to quickly adopt new offerings, such as the Benchmarking tool released in 2014 that helped them improve their email marketing.
Internally, Twiddy had heaps of data, but it was all buried in spreadsheets that often took days to sort through when analysis was needed. To modernize their data warehousing and analysis capability, Twiddy migrated the data to SAS Business Analytics. SAS is a well-established software suite for managing and analyzing data. While the full toolset has a wide range of function, including hooks for Hadoop and in-memory analytics, there are basic offerings that rely on more traditional techniques. Twiddy invested $40,000 in their SAS platform and saw a 15% reduction in financial losses caused by processing errors. Twiddy hoped to recoup their investment in three years; instead, it took them only one.
Small businesses do not need to make major leaps into brand new tools in order to improve their data situation. Small investments of time and money using widely adopted tools can simplify management, provide insights, and deliver results.
About this Research
CompTIA’s Big Data Insights and Opportunities study builds on prior big data research conducted by CompTIA. The study focuses on:
- Tracking changes in how businesses capture, store, manage and analyze data
- Identifying key end user needs and challenges associated with data
- Gauging familiarity and incidence rates for big data initiatives
The study consists of thr e sections, which can be viewed independently or together as chapters of a comprehensive report.
Section 1: Market Overview
Section 2: Usage Patterns
Section 3: Workforce Perspectives
The data for this quantitative study was collected via an online survey conducted during September/October 2015. A total of 402 professionals participated in the survey, yielding an overall margin of sampling error at 95% confidence of +/> 5.0 percentage points. Sampling error is larger for subgroups of the data.
As with any survey, sampling error is only one source of possible error. While non>sampling error cannot be accurately calculated, precautionary steps were taken in all phases of the survey design, collection and processing of the data to minimize its influence.
CompTIA is responsible for all content contained in this series. Any questions regarding the study should be directed to CompTIA Market Research staff at [email protected].
CompTIA is a member of the Marketing Research Association (MRA) and adheres to the MRA’s Code of Market Research Ethics and Standards.
Read more about Industry Trends.

 Download Full PDF